
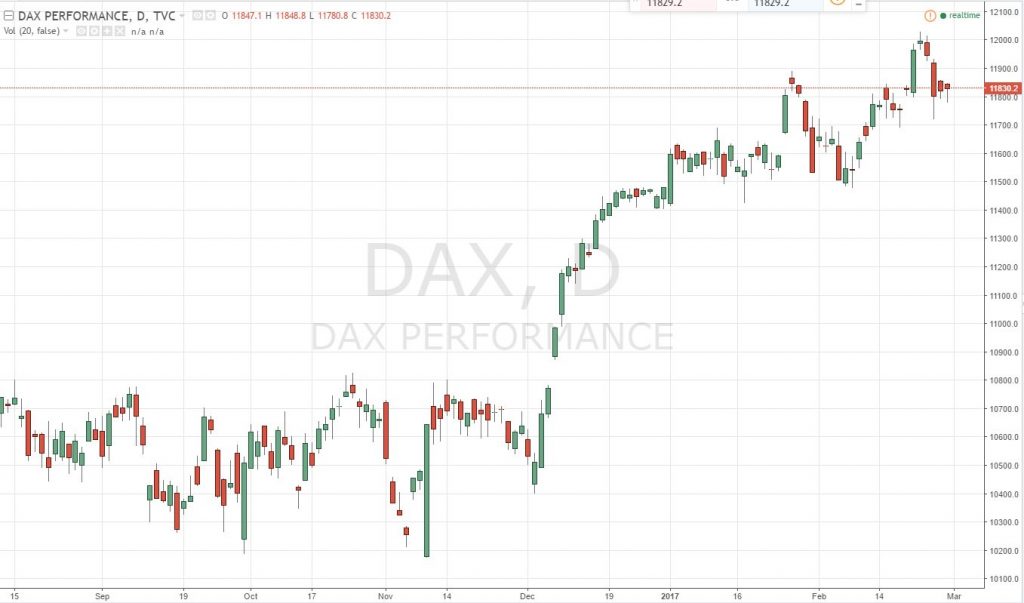
Candlestick charts were invented by Japanese rice traders in the 17th century and were used for trading rice contracts from around 1710 onwards. Fundamentally, these are charts that contain more information than the very classic chart, the line chart, and therefore they also provide an opportunity to read the market in a better way.
| Try our free forex signal service via Messenger: Click here |
The Japanese rice traders achieved legendary wealth by understanding the details of candlesticks and what they tell us about the market, and nowadays this type of chart is also used by the vast majority of professional players in the market. A regular line chart only shows the closing price, whereas a candlestick chart shows an opening price, the lowest price, the highest price, and the closing price for the selected time period.
When we look for signals from candlesticks, we are looking for signals that can show us what happens just BEFORE major price movements and give us signs as to whether we should enter or exit a market. Candlesticks can help show us this. They can give us an idea of the likelihood that the market will continue to move in a particular direction.
Note here that we use the word probability. None of these patterns can predict the future with 100 percent certainty, but they can give an idea of the probability that the market will continue in a certain direction. Candlesticks show us patterns in the charts that recur day after day, month after month, year after year.
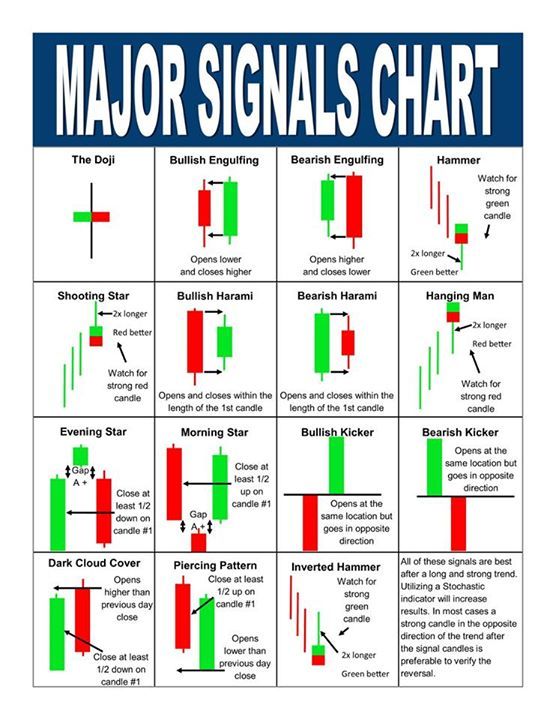
We have initially chosen to focus on 12 candlestick patterns that fall under the designation ‘Major Candlestick Signals’, which are both effective and easy to understand and use when analyzing the markets. Additionally, over time we will supplement with other interesting patterns.
Of course, there are a number of other patterns that can also be effective and profitable, but many of the 12 patterns that we have initially chosen to focus on are distinguished by, among other things, being easy to identify on a chart. You can see an overview of the patterns here:
Candlesticks should not be analyzed alone
A good guideline within technical analysis is always that the individual signals, indicators, etc., should always be confirmed by one or more other types of signals, indicators, etc.
| Try our free forex signal service via Messenger: Click here |
Stephen Bigalow, an American candlestick expert, trades, among other things, based on the 12 patterns, whilst also using a variety of indicators to determine more precisely when specific buys or sells (and associated stops and take profits) should be made. One of these setups he uses consists of the following indicators:
- The Stochastics indicator with settings 12,3,3 (which may vary depending on the time horizon of the charts)
- Three simple moving averages – SMA – at 20, 50, and 200 days
- An exponential moving average – EMA – at 8 days – the so-called trigger line
The Trigger Line, or simply T-Line, is a commonly used technique in technical analysis and can be compared somewhat to Fibonacci numbers, which in certain cases tend to appear repeatedly in price charts. The underlying idea is that if you go long in an instrument in a rising market and the instrument closes above the T-Line on the chart, there is a certain probability that the upward trend will continue. The same applies if you are short in a declining market and the instrument closes below the T-Line on the chart. As long as the instrument continues to trade below the T-Line, one should stay in their position, as there is an assumption that the trend will persist. Therefore, one can use the technique to define stop losses and take profits. You can read more about the theory behind the T-Line here.
In this context, Stephen Bigalow works, among other things, with a simple rule (though with several exceptions), which states that if you see a candlestick reversal pattern in an upward direction, you can, for example, buy an instrument if the price is above the T-Line and hold the instrument until you see a candlestick pattern pointing in the opposite direction and the price goes below the T-Line. You can possibly learn more about the procedure in this YouTube video with Stephen Bigalow.
Furthermore, Stephen Bigalow has uploaded this video, which covers the 12 ‘Major Candlestick Signals.’ The video can also be seen in a very short version here.
If you are unsure about what candlesticks are exactly, you can benefit from reading this article.