
When the stock market falls significantly, it can be especially tempting to buy quickly. You don’t want to miss the “unique” opportunity at a good price, and in the rush, you may forget both your common sense and your normal analyses.
| Try our free forex signal service via Messenger: Click here |
In trading, they say you’re trying to “catch a falling knife” because you often end up hurting yourself in the attempt to catch a precise market reversal.
Generally, we recommend that you DO NOT try to catch a falling knife.
But if, for some reason, you are still tempted, it’s important that you have a strategy. Below, we have described four methods to increase the probability of catching the knife at the right time.
Method 1: Buy when the price hits a round number
Prices often tend to react when they come down to a “round number.” It could be, for example, 100, 50, or 20. The price often dips a bit below the round number but can suddenly bounce back – just like a beach ball being released underwater. See an example in Swedbank’s stock, which hit the bottom around the SEK 100 level in 2020:
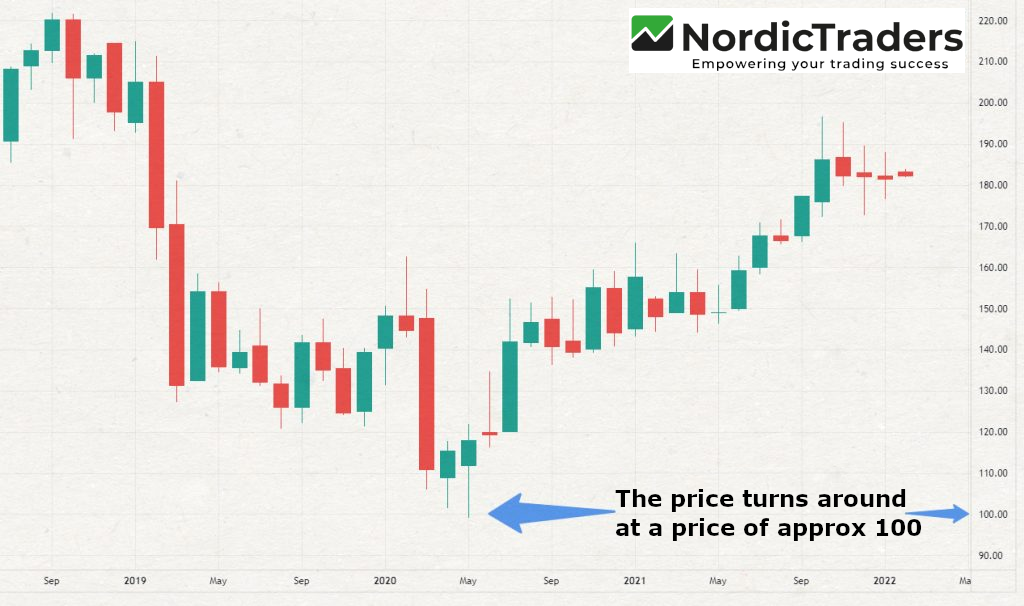
Swedbank’s price development on a one-month chart. Note the price level around 100.
From late 2018 to March 2020, Swedbank’s share price fell by more than 50%. The price only reversed when it reached 100 SEK (99.14). The price typically goes just below a round number and then quickly bounces back up. Click on the image to enlarge.
| Try our free forex signal service via Messenger: Click here |
Examine the chart for your favorite stock or index and see if it has previously reacted to round numbers. If it has, there’s a possibility it will do so again in the future.
Method 2: Wait for a hammer
If you’re going to catch a falling knife, it needs to happen quickly – because then it’s no longer a falling knife. Instead of buying at a random level, you can wait for a small turning point. This could be, for example, a hammer candlestick. It’s easy to recognize because it looks like a hammer.
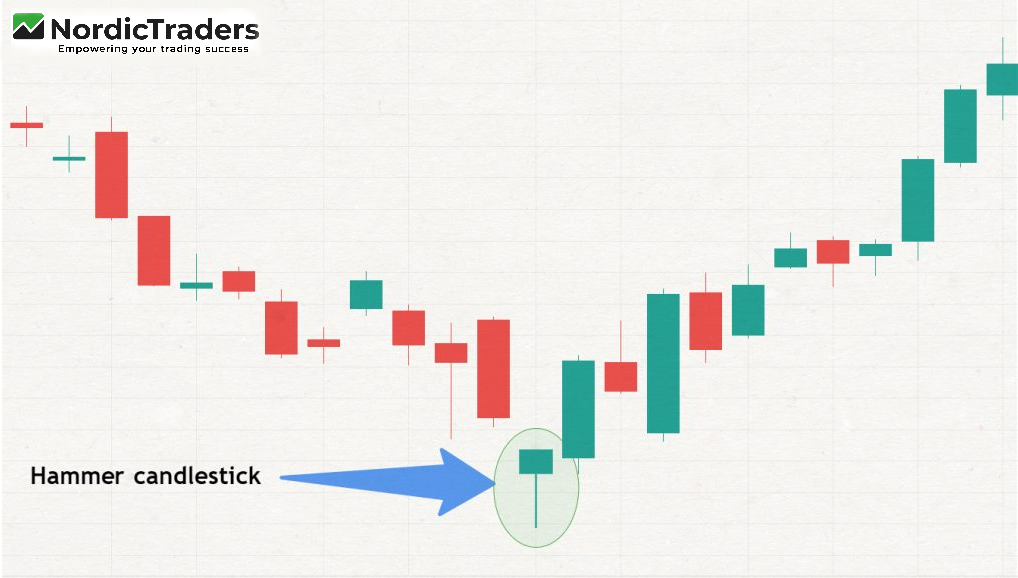
The above is an example of a so-called hammer candle. It has a relatively small “body” compared to the “tail” (the narrow line). The long tail indicates that it was bought up when the price reached that level and is thus a (small) sign of a reversal.
We are looking at the daily chart here, so each candlestick represents the price development over a single day. The long “tail” (the narrow line) on the candlestick means that the price during the day went down to the bottom level on the tail but then reversed. In other words, it suggests a certain buying interest and thus a potential bottom.
During the Corona crash in 2020, Apple’s stock price fell by 35% in one month. The price only turned around after a hammer candlestick had formed.
See the graph below:
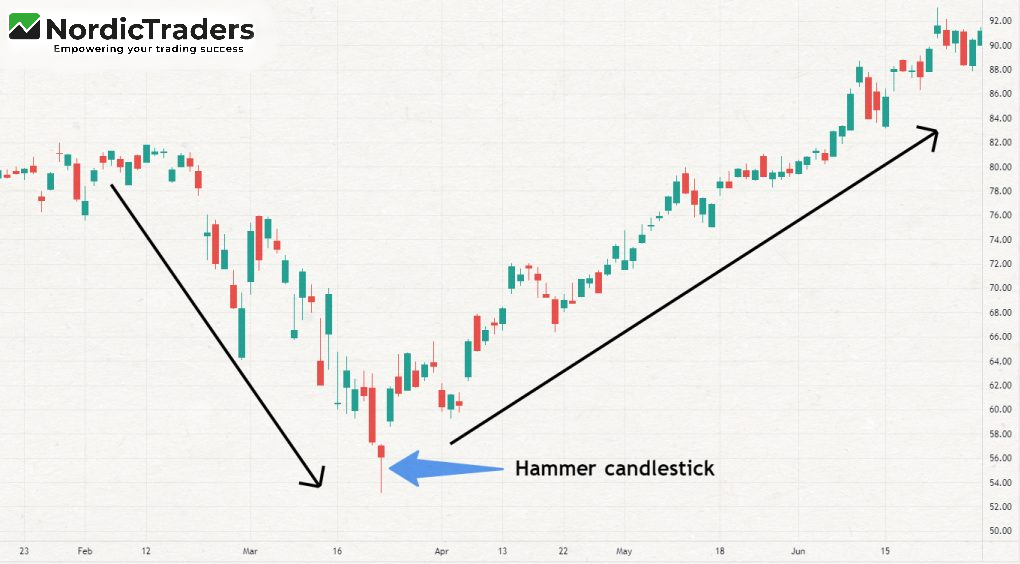
If you look at charts during significant market declines, you will often see this type of candlestick appearing at the absolute bottom. There is no fixed definition of how a hammer candlestick looks, but many prefer to see that the “body” represents at most 1/3 of the entire candlestick. The longer the tail, the better.
Remember that there is no guarantee that a hammer candlestick will form. There are also other candlestick patterns to keep an eye on. In our free Kickstart Your Day Trading course, we dedicate an entire lesson to one of the most powerful candlestick signals you can use to catch market reversals.
The above candlesticks are indicated on a daily chart, but you can also trade hammer candlesticks on hourly charts or even 5-minute charts. It simply changes your time horizon in terms of how long you should be in the respective trade.
Method 3: Slice into the market
When you “slice” into the market, you buy a lot of small portions without trying to precisely catch a potential reversal. This is also known as dollar-cost averaging because you divide your investment into several portions and buy at different predetermined levels (if the price reaches those levels). So, you accept that you might not hit the absolute bottom, but instead, you aim for, on average, “a reasonable price.”
Ideally, it should be a stock that you’ve wanted to buy for fundamental reasons and are willing to hold for an extended period.
For instance, if you have 60,000 DKK to invest in a falling stock, you could buy in three installments of 20,000 DKK each time. You can use various methods to determine where these buying levels should be located. The simplest method is to buy when the price has fallen a certain percentage from the top, for example, at 20%, 30%, and 40%. It may look something like this:
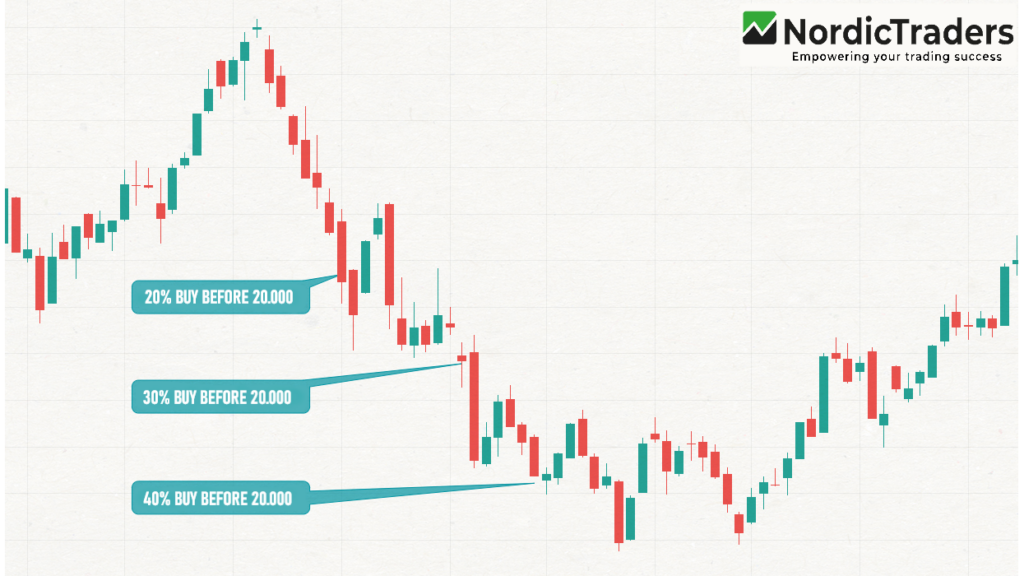
Of course, you can also use other methods to determine the buying levels, for example, one of the methods discussed in this article.
Method 4: Buy at a significant support level
This method requires a certain level of knowledge in technical analysis but is also one of the most effective. Here, we aim to identify an area where the price has a higher probability of reversing than other levels. You can look for:
- Support area (which was previously resistance)
- Fibonacci levels
- Trendlines
- ABCD patterns
- Pivot points
Keep in mind that we are looking at a stock or asset that is dropping significantly. Therefore, it can be a good idea to zoom out and look at the weekly or monthly chart for a broader perspective. Below is the weekly chart of Apple’s stock price during the 2020 Corona crisis. Here, we observed several factors suggesting that the price could reverse at this level:

This level was particularly interesting for these reasons:
- The price comes down to an area that has previously acted as resistance. After the resistance area was broken, we can now assume that it will function as a support level the next time the price reaches it.
- The price hits a trendline.
- The price comes down to the Fibonacci level of 0.618, which is a level where the price often tends to react.
The more factors you can find suggesting that the price may reverse in the area, the better. However, despite the arguments for a purchase here, there are, of course, never any guarantees that the price will turn around. But it is certainly better than buying blindly.
| Try our free forex signal service via Messenger: Click here |
Some final advice
Learn to say no.
Even though it feels like a “once-in-a-lifetime opportunity,” it is unlikely to be the case. Knives fall in the stock market every day. Therefore, only choose the best opportunities and buy only companies and markets that you know and have analyzed. Only in this way will you be able to withstand the possible psychological pressure that comes with holding onto deep red numbers for a long time before the potential trend reverses.
Do not buy the first drop
You probably know it: The price drops sharply, and you buy with the feeling that you have made the trade of your life. To your dismay, you discover that it keeps falling.
Now you dream of having saved all the money to buy at the new, lower level. Therefore, do not buy the first drop, but wait for AT LEAST one more drop. Preferably two.
Think of the worst-case scenario
You buy and are “sure” that the price will soon turn, but to your great frustration, it keeps going down. You see red numbers and keep watching the price, and when you think it can’t fall further, it continues downward! Maybe it affects your mood!? Your private life!? Perhaps you needed the money for something else?
Even though you are hopeful when you buy, it is extremely important to imagine the worst that can happen. How would you feel, and how would you act in such a situation?
For horror and a warning, you can look at this chart of the Swedish company Fingerprint Cards, which was once very popular to trade in Denmark. Many believed that the stock was unstoppable and chose to buy it again and again, even though it fell like a stone:
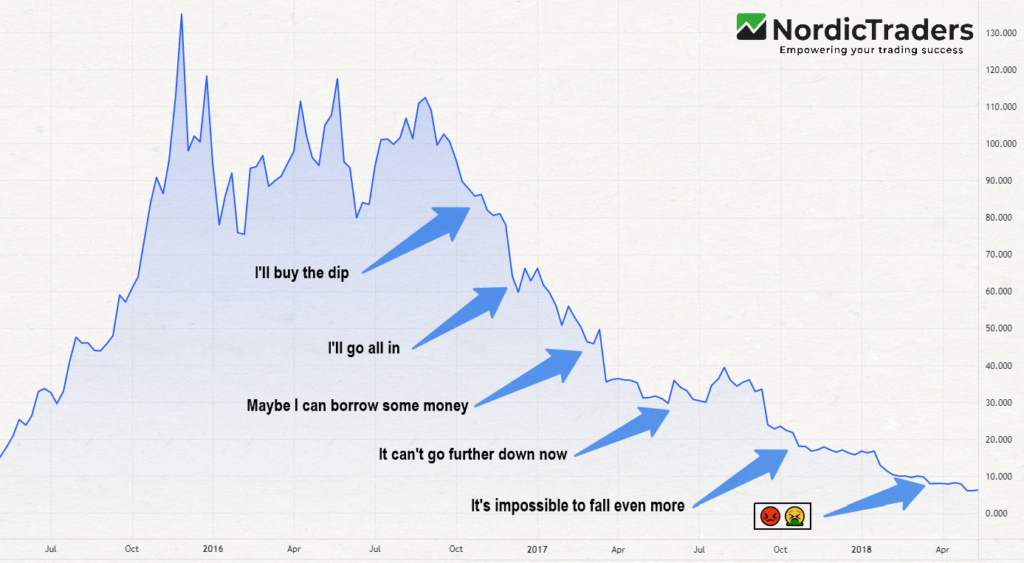
Many investors lost significant amounts in Fingerprint Cards as the stock price fell deeper and deeper during 2016-2017. If you decide to catch a falling knife, it is essential to imagine the worst that can happen.
The price has indeed risen slightly since the bottom of Fingerprint Cards, but it has not come close to the previous peak. The money invested at the top is likely lost.
We began this article by advising against catching a “falling knife.” However, if you still decide to do so, remember to only invest money you can afford to lose.
Good luck!