
Price breaks offer great opportunities for the technical trader. But very often, a trade around a price break ends as a huge disappointment and lost money. This article helps you understand how to trade price breaks correctly.
| Try our free forex signal service via Messenger: Click here |
Most traders who use technical analysis are always on the lookout for so-called price breaks. These are moments when a price breaks through resistance or support levels relative to previous price levels. When a price breaks through such an area, you often see momentum, and the price suddenly moves quickly up or down. This is because a lot of buy/sell orders are typically activated in that area. Many inexperienced traders tend to ‘get carried away’ by the atmosphere when they experience a price break, and they rush to enter a trade in the hope of quickly joining in. However, the trade often ends in disappointment and lost money because the price does not continue after all, but instead slows down and reverses. This situation is called a false price break. And it happens all the time.
Let’s take a look at a real price break:
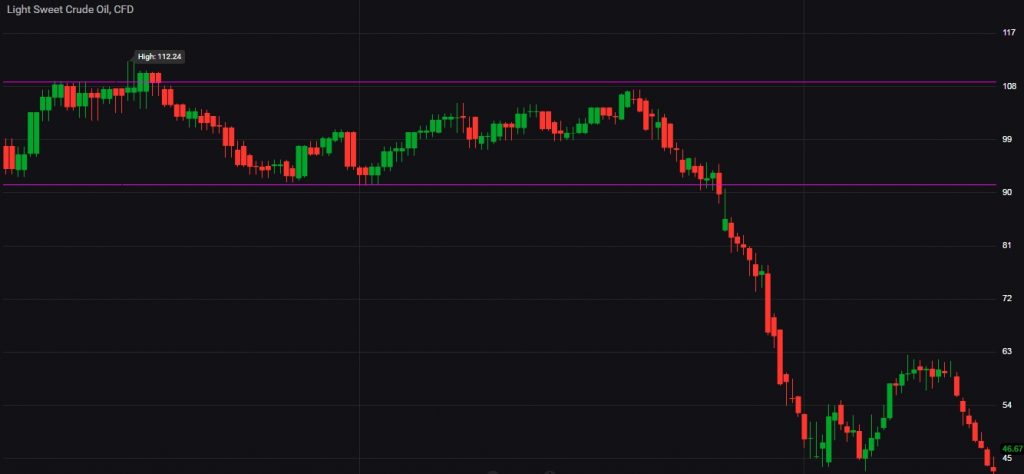
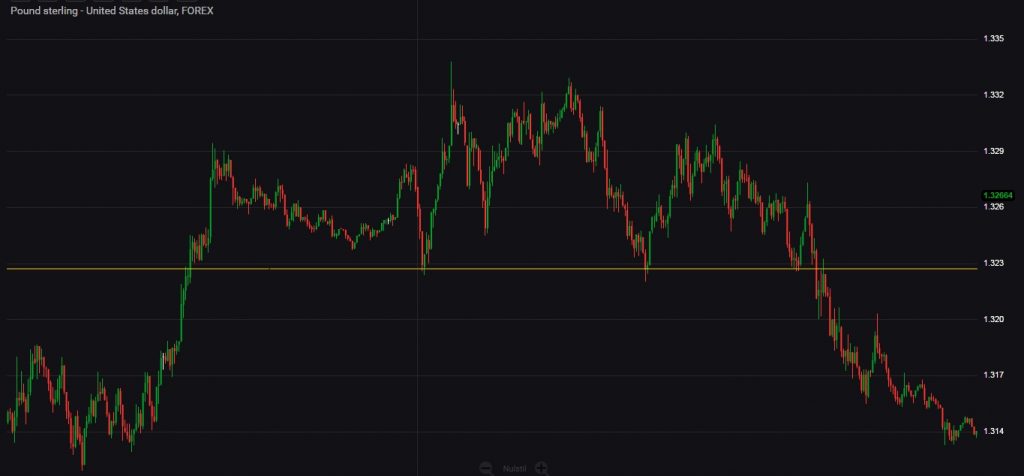
The above graph shows a famous price break in the price of crude oil that occurred in the summer of 2014. The price of crude oil had been moving in a sideways range for many months with support just above 90 USD. However, in the summer of 2014, the price breaks through the support level, and then it quickly drops down to half its price at 45 USD. It was a price break that ‘succeeded’. Price breaks can be found on all time horizons – including yearly charts, weekly charts, and even minute charts. The following price break occurs in the GBPUSD currency pair on a five-minute chart (fig. 2). The price finds support around 1.323, but after a few hours, where the level is tested 4 times, the price finally breaks through and continues downwards.
It is not difficult to understand why price breaks are appealing to many traders. When looking back at past price breaks and seeing the large movements they created, one can easily regret not being in the market at that exact moment. However, price breaks are often just as enticing as they are dangerous. For example, consider the following examples where a price break ends as a ‘false signal’.
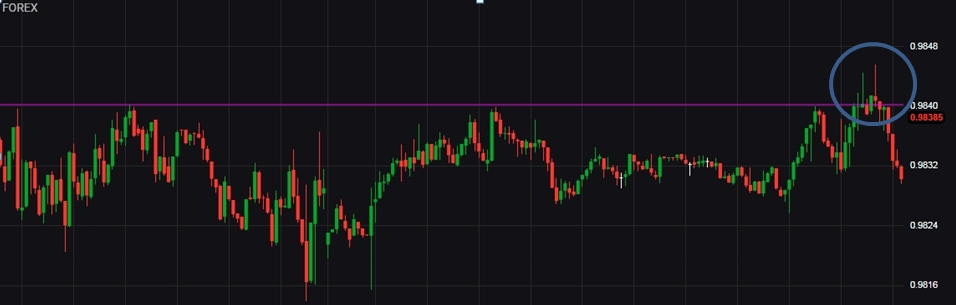
In the above example (fig. 3), the price finds support in the area around 0.9840. But suddenly the level is breached, and there appears to be a little momentum in two rounds up towards 0.9848. See circle. Nevertheless, this price break ends up leading nowhere, and the chart moves back into a sideways movement under the resistance level. Naturally, these kinds of price breaks are the ones you ideally want to avoid.
The big question now is how to avoid the false price breaks and instead choose the ‘right’ ones. First of all, it is important to understand that one can never be sure that it is a genuine price break. In the pursuit of price breaks, you will certainly end up with many false ones, but fortunately, there are several things you can do to choose the right ones – and in cases where it still goes wrong – to limit the damage.
Before we go through a specific trade, it is important to establish the following:
- The larger the time horizon you look at, the more certain a price break is.
- The more times the price has acted as support/resistance, the more valid the area is, and the greater the momentum you can expect when the level is breached.
- If support/resistance also lies around a round number – for example, 100, 500, 1000 – the level is usually stronger, and the greater the momentum you can expect when the level is breached.
- Avoid spontaneous and quick reactions when a resistance/support level is breached. Think it over and give yourself time to find the right entry. If you don’t manage to join, it’s just too bad. Instead, be happy about all the times you DIDN’T act spontaneously, and where you just avoided a false price break and subsequent loss.”
Let’s now look at how to increase the chance of choosing a genuine price break.
A. Price break supported by a closed candle
The simplest method to identify a genuine price break is about patience. Many traders protect themselves against false price breaks by waiting until the price has consolidated over/under the resistance/support that has just been breached. This is done by waiting for one or more of the subsequent candlesticks to open and close on the other side of the level – or to completely leave the level in terms of the highest and lowest price.
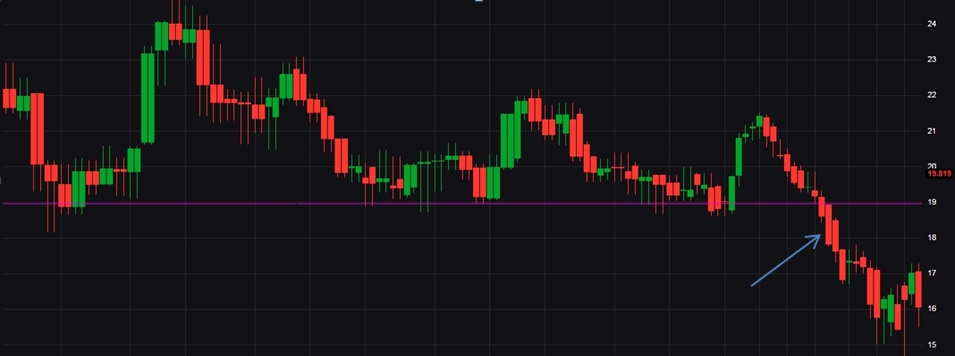
In the above example (fig.4), the price of silver meets resistance in the area around 19 USD. Eventually, the level is breached downwards, and a candle is formed that both opens and closes on the other side of the resistance (see the arrow). In this case, the highest and lowest levels of the respective candle are also free from the resistance level. This method is most secure in higher timeframes, for example, daily and weekly charts. Once a price break has been confirmed, you can use a smaller timeframe to ‘time’ the right entry into the market.
B. Revisited price break
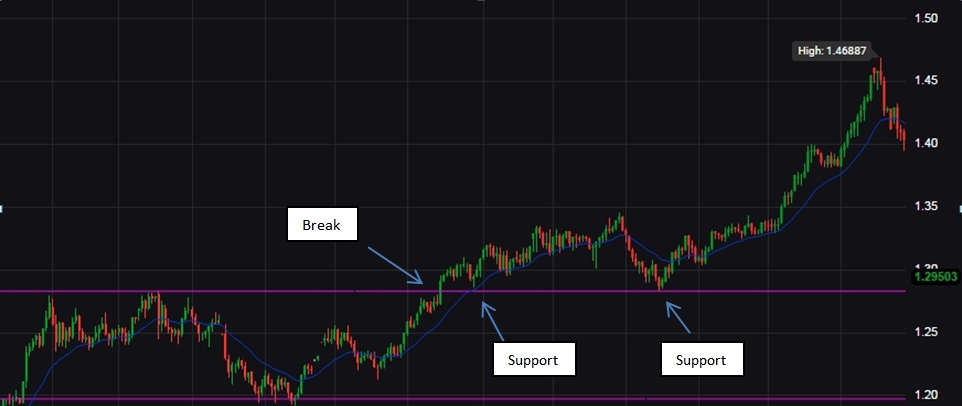
Very often, as a trader, you will experience that a broken resistance is ‘revisited’ shortly after a break, after which the resistance now acts as support (fig. 5). Or vice versa. It requires patience to wait for such a re-trace, and often you will miss a trade because the price does not turn but just continues further. Still, it can be worth the effort to wait for a re-trace. Once you have established that the old resistance suddenly acts as support, there is all the more certainty that the break is indeed a reality. In the graph below, see how the resistance is breached, after which the level shortly after becomes support in two rounds, before the price then really takes off to the north.
C. Price break supported by volume
Volume is unfortunately an overlooked factor among many nordic day traders. Volume is a measure of the total number of papers traded in a particular asset over a given period. If 10.000 papers in Vestas are bought and sold during one hour, and 50.000 papers are bought and sold in the next hour – then the volume is highest in the last hour. In other words, volume is a measure of how much interest there is in a particular asset over a given period. As a starting point, however, volume does not say anything about whether a price is going up or down – it only says something about interest. Still, this knowledge can be used for quite a lot. If the volume is increasing during a solid price break, it must necessarily mean that there is great interest in trading the asset at the new price. This can again conclude that the particular price break has a chance of being valid.
When the price has shot through resistance/support, and the initial excitement among traders has subsided, you will typically see a minor pullback in the price. If trading based on volume, one would like to see that this pullback occurs based on lower volume. At some point, the price may even return to the old resistance, which has now become support – and here the volume trader again wants to see increased activity/volume in the direction of the trend. Thus, the original price break is truly confirmed.
| Try our free forex signal service via Messenger: Click here |
It requires great experience to trade based on volume, as the picture of price action and volume is rarely completely clear. But if you master it, it can be a crucial factor for success.
Many trading platforms do not provide access to volume data. If you do not have access to volume, you can supplement your trading with free data from, for example, TradingView, which provides free access to volume data, among other things.
In the example below, the price finds support around 41 USD. When the level is breached, it occurs under high volume, after which the volume falls relatively during the pullback, and again rises as the price continues in the direction of the new downward trend. This suggests a valid price break. Trading price breaks based on volume can advantageously be combined with points A and/or B.

How to Avoid Major Losses with False Price Breaks
As previously mentioned, it is virtually impossible to avoid entering a false price break at some point – regardless of confirmed candles and indicators. In those cases, you want to limit the damage. Fortunately, a false price break will quickly reveal itself if the price dips below/above the previous support or resistance. Therefore, you want to set a stop relatively close to the resistance, but with room for the price to re-trace and test the old resistance/support. The target should, of course, be in a healthy relationship to the set stop in a ratio of at least 1:2-3.
When setting your stop, you should consider the size of the old price range. The larger the price range, the larger the swings you can expect – also after a potential price break, and this must naturally be taken into account in your stop.
