
Wedges, like trend channels, are essential for understanding market developments and can trigger both buy and sell signals in the same way as trend channels do.
Wedges also resemble pennants – read about pennants here.
In the chart below, you can see the price development of Yahoo stock over the last two years, from August 2013 to August 2015. The chart forms a wedge-like pattern from after 2013 and a year forward, which is broken in August 2014. This break is marked with an arrow on the chart, highlighting the buying opportunity that arose in the stock.
| Try our free forex signal service via Messenger: Click here |
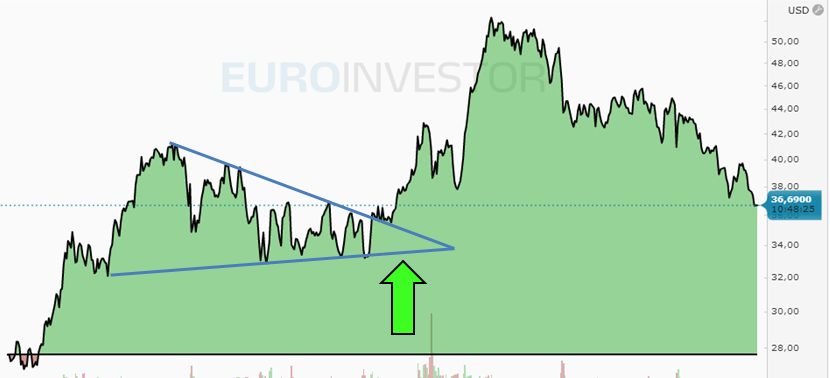
In this case, the wedge thus gave a buy signal, but in other situations, a break of a wedge in a downward direction can naturally also provide a sell signal.
This is an example of how wedges can be used in more long-term trades, but wedges are used by day traders across all kinds of time horizons, including the very short ones. They can function quite effectively as buy and sell signals, especially if supported by other indicators.