
If you want a simple indication of whether a security is overbought or oversold, Williams %R may be the perfect indicator.
Williams %R, also known as ‘Williams Percent Range’, is a momentum indicator that compares a stock’s recent closing price with the price range the instrument has moved in over a period, typically 14 days. The purpose is to find out whether the price is trading high, low, or at a mid-level based on the selected period, and ultimately indicate overbought or oversold levels. The indicator can thus be used to establish potential entry and exit points in the market.
| Try our free forex signal service via Messenger: Click here |
The indicator can be compared to the stochastic oscillator, as they both compare an instrument’s closing price with its highest and lowest price over a period. The difference between the two indicators is that Williams %R generates negative values, whereas the stochastic oscillator produces positive values.
In general, any momentum indicator is a tool that can help predict future trends by using recent price and volume data on the underlying instrument. They provide a trader with the ability to see where the current price is relative to its historical trend.
Calculation of Williams %R:
Most trading platforms have the Williams %R indicator available, which is often found under ‘indicators.’ Therefore, it is not necessary to calculate the formula for Williams %R manually, but for those interested, the formula used to calculate Williams %R is explained below.
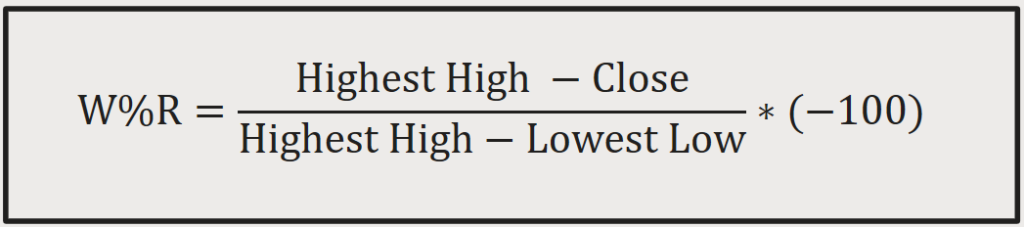
If we base the calculation on a 14-day period, Williams %R is calculated as the instrument’s highest price in the last 14 days minus today’s closing price. This value is then divided by the instrument’s highest price in the period minus the lowest price in the period. Finally, the entire fraction is multiplied by -100.
Sell and buy signals:
Williams %R moves between levels 0 and -100. Readings from 0 to -20 are considered overbought, whereas readings from -80 to -100 are considered oversold.
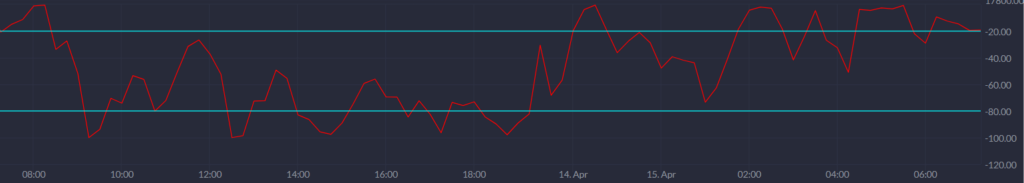
If Williams %R is above the value of -20, the instrument is overbought. When Williams %R breaks below -20 again, it indicates that the instrument will continue in a downtrend, and therefore a sell signal is generated. Conversely, if Williams %R is below the value of -80, the instrument is oversold. When Williams %R breaks above -80 again, it indicates that the instrument will continue in an uptrend, and therefore a buy signal is generated.
A signal based on divergence can also occur. If the instrument is falling and Williams %R is rising, it is called positive divergence. Positive divergence indicates that the instrument will reverse from a downtrend to an uptrend, thereby generating a buy signal. Furthermore, if Williams %R is falling, while the instrument is rising, it is called negative divergence, which triggers a sell signal.

Here, we see the price of the German DAX index over the last 6 months on a 1-day chart. We now take a closer look at three places on the chart marked with arrows, where the Williams %R indicator predicts some winning trading opportunities.
At the end of 2017, the Williams %R indicator breaks below -80, indicating that the DAX is oversold. In early January, Williams %R breaks above -80 again, resulting in a buy signal. This signal, like the previous example, would have yielded almost 500 points.
Again on January 18th, Williams %R breaks above -20, which as mentioned, indicates that the DAX is overbought. Five days later, Williams %R breaks below -20, and a sell signal occurs. A trade that could have possibly yielded around 1000 points.
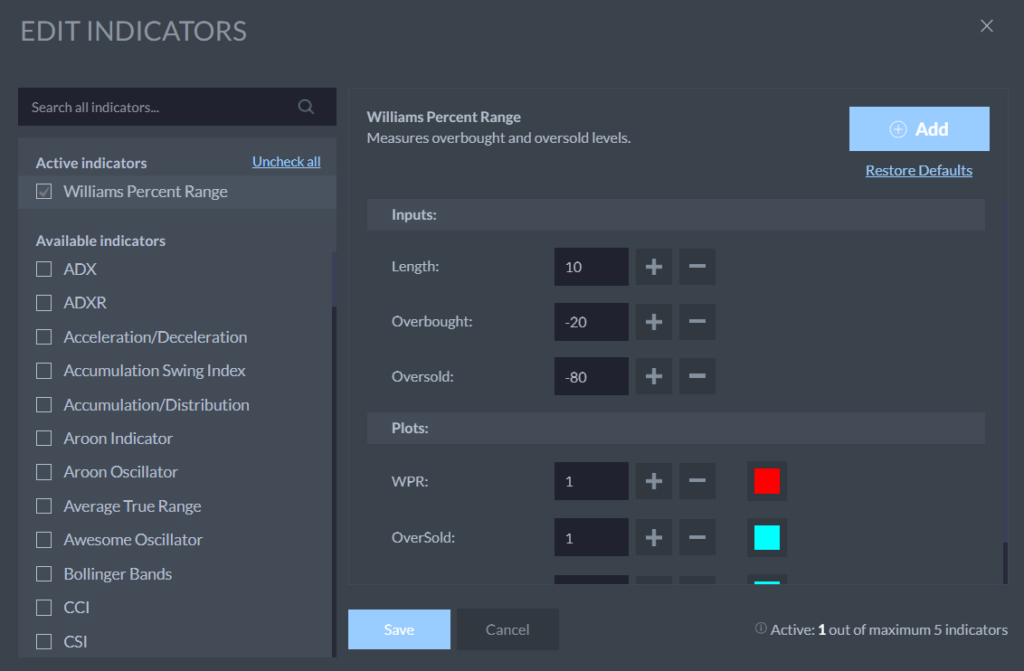
You can activate the Williams %R on Markets by clicking “Indicators”, and then “Williams Percent Range”. Markets has set the standard time range to 10, however, the normal setting for most traders is 14.
| Try our free forex signal service via Messenger: Click here |