
This daytrader strategy, in brief, consists of a moving average and seven so-called pivot lines. The trade is initiated when a specific pivot line is breached, and the trade is stopped again when the price crosses the moving average.
| Try our free forex signal service via Messenger: Click here |
The pivot lines constitute some extremely important price levels in most currency rates. Yet, relatively few Nordic traders use these lines when trading forex. In the following, we will describe a relatively simple strategy using pivot. If one uses the strategy, one should gradually get a good sense of how the major currency crosses move. It is also a strategy that is relatively easy to follow and doesn’t require too much experience. The strategy is primarily made for the currency cross of the pound against the dollar, also called ‘The Cable’ or simply GBP/USD. However, the strategy can probably also be used in EUR/USD.
The pivot system is a technical tool that was originally developed by floor traders to get a sense of how a given price chart relates to the price from the previous day. One does not need to understand the calculation to be able to use the pivot strategy, as most trading platforms can draw the pivot lines completely automatically. The box ‘How pivot is calculated’ explains the mathematics behind the pivot lines.
Pivot means an ‘area around which something turns’, and in this case, it is the price that revolves around a line/price. As a starting point, the pivot line (P) is calculated by adding the previous day’s closing price (C) to the previous day’s highest (H) and lowest price (L). This value is divided by three to find the average: P = (H + L + C) / 3.
P is called the pivot line, and it is the most important line for most pivot traders, as it indicates a kind of average of the previous day’s price.
In connection with the pivot line, a couple of extra lines are also drawn, namely the so-called support (S) and resistance lines (R). These lines help define how far the price moves away from the average. These lines are calculated in the following way:
- R1 = P + (P − L) = 2×P − L
- S1 = P − (H − P) = 2×P − H
- R2 = P + (H − L)
- S2 = P − (H − L)
- R3 = H + 2×(P − L) = R1 + (H − L)
- S3 = L − 2×(H − P) = S1 − (H − L)
Pivot strategy
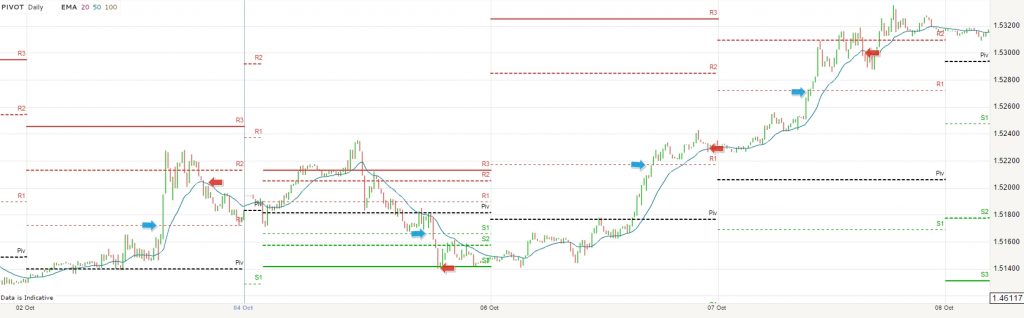
If you want to use the pivot strategy, you need to find the chart that shows the GBP/USD currency cross on a 5-minute interval. Next, you need to find the analysis tool called ‘pivot’ or ‘pivot lines’. This tool is found in most trading platforms under ‘technical’ or ‘drawing’. When pivot is activated, up to seven lines appear across the chart. The middle line is called the pivot line, and the outer lines are called support and resistance lines (S1-S3 and R1-R3). Notice how the price often settles around the pivot line (P) at the beginning of the day and then moves out towards the support and resistance lines later in the day. Often, you would see that the price is ‘attracted’ to the pivot line and stops near the outer support and resistance lines. Once the pivot lines are placed on the chart, you also add a moving average of 50. This tool is often called MA and should be found in all types of trading platforms.
Note: On Mondays, there can be a big difference in pivot numbers for the individual trading platforms. Some account for Sunday’s late trades, others do not. You can use this tool if you want to ensure the correct pivot numbers on Mondays.
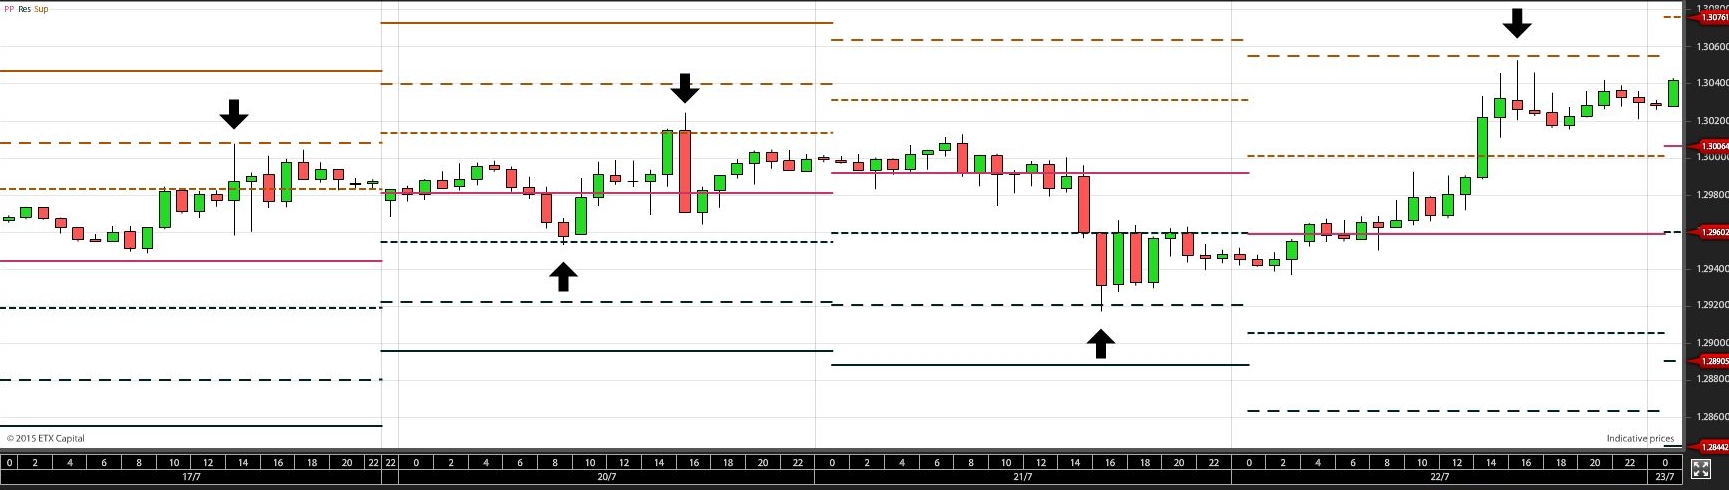
The pivot strategy is about buying or selling when the price breaks the first support/resistance line above or below the actual pivot line in a specific way. These support/resistance lines are usually called S1 and R1. When one of these lines is breached by the price, according to the strategy, it’s a sign that the price can’t hold the support level, and therefore the price should move further up or down. This is what the trader tries to exploit.
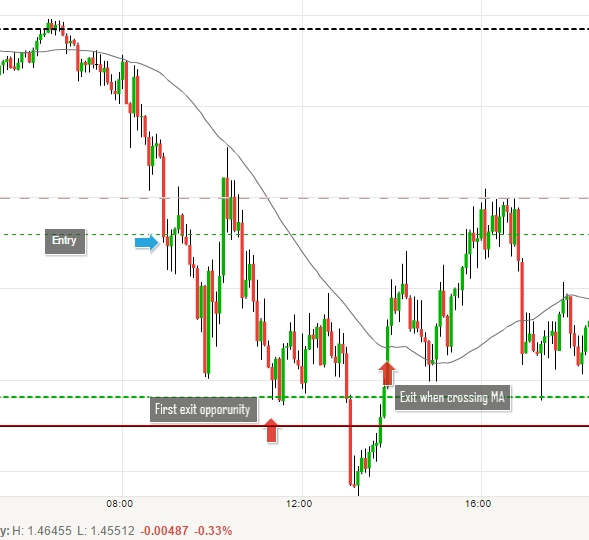
In addition to pivot lines, as mentioned, the strategy also uses a moving average (MA) with a value of 50. This moving average is used to determine stop and target in such a way that the trade is stopped when the price crosses the moving average, regardless of whether the trade is in profit or loss. The graph below shows examples of entry and stop/target.
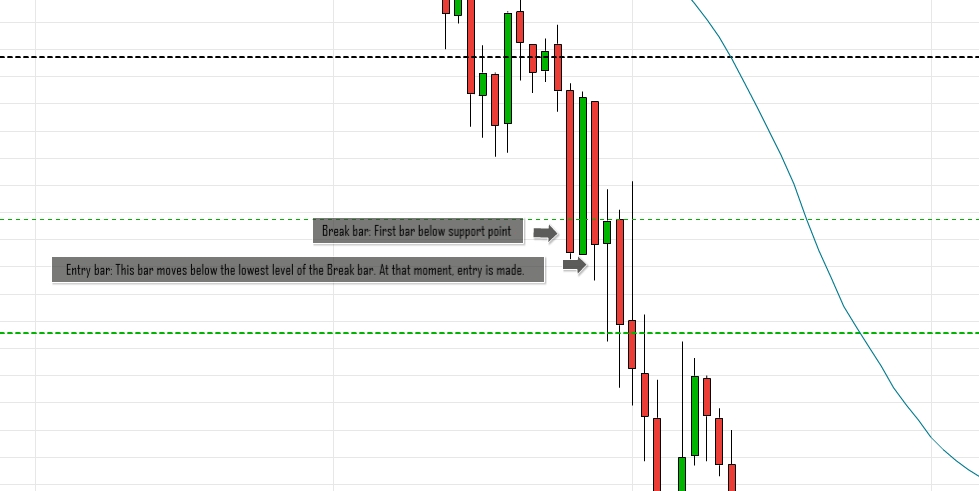
In the simplest version of the strategy, you enter the market as soon as the support/resistance line (S1 or R1) is breached. However, this is NOT recommended. The reason is that the price often stops and gets ‘muddled’ around these support/resistance lines. Often, you will therefore experience that the price shoots through the support/resistance line, but then does not have enough ‘strength’ to continue, after which the price turns completely around. As a trader, you will therefore often be fooled and lose valuable points.
For that reason, it is important to have patience when the price approaches the support/resistance line. The strategy dictates that one should first see a 5-minute bar close on the other side of the support/resistance line. Then, one must wait for another 5-minute bar to break under/over the price of the first bar that broke through the support/resistance line. When this happens, the trade is placed immediately in the direction of the trend.
When the trade is active, it is important to immediately set a stop loss to protect yourself against sudden and violent movements in the market. Often, you can place a preliminary stop around the place where the moving average (50 MA) is at the time of entry. Once the stop is set, you can relax and watch your trade develop – hopefully in the direction of profit. Exit occurs when the price breaks the moving average – regardless of whether the trade is in loss or profit. However, if the price begins to form a base or stops around the next support/resistance line (called S2 and R2), you can in good conscience disregard the moving average and take profit at this point. However, you should also close your trade before the market shuts down, typically around midnight. You should NOT risk an overnight trade.
| Try our free forex signal service via Messenger: Click here |
As a final detail to this pivot strategy, be aware that you can only make an entry if the price has crossed through support/resistance in the direction of the middle pivot line. Therefore, you cannot take the trade if the price breaks through R1 from above and down, or through S1 from below and up. However, this rarely happens.
If you want to give your pivot strategy even more ‘weight’, you can experiment with letting the signals be backed up by certain candlestick formations. Perhaps a doji candlestick suddenly indicates that the market is about to turn, and then you might consider changing your entry or exit.
REMEMBER: A strategy does not work in all markets and at all times. The fact that a strategy has worked over a certain period is no guarantee that it will work in the future.