
The stochastic oscillator – also known as stochastics – is one of the most recognized indicators for assessing momentum in technical analysis. The idea behind this indicator is that in an uptrend, the price should close near the highest point of the range in which it moves in each period. This signals that the market will tend to continue upward. In downward trends, correspondingly, the price should close near the bottom of the range in which it moves.
| Try our free forex signal service via Messenger: Click here |
The stochastic oscillator moves within a range between 0 and 100, and it usually contains two lines. The first line is called %K, which is the basic element of the indicator, and it is calculated based on the description above. The second line is called %D, and it is simply a moving average of %K. This line is considered the most important of the two, and the one that provides the best signals. For this reason, the %K line is often omitted.
If the stochastic oscillator, for example, uses the last six trading periods for the calculation, this means that on a 1-hour chart, the closing prices of the last 6 hours are used to calculate the values.
The oscillator can be used in many different ways. Most commonly, it’s used to check for divergence in relation to the price. See the chart below.
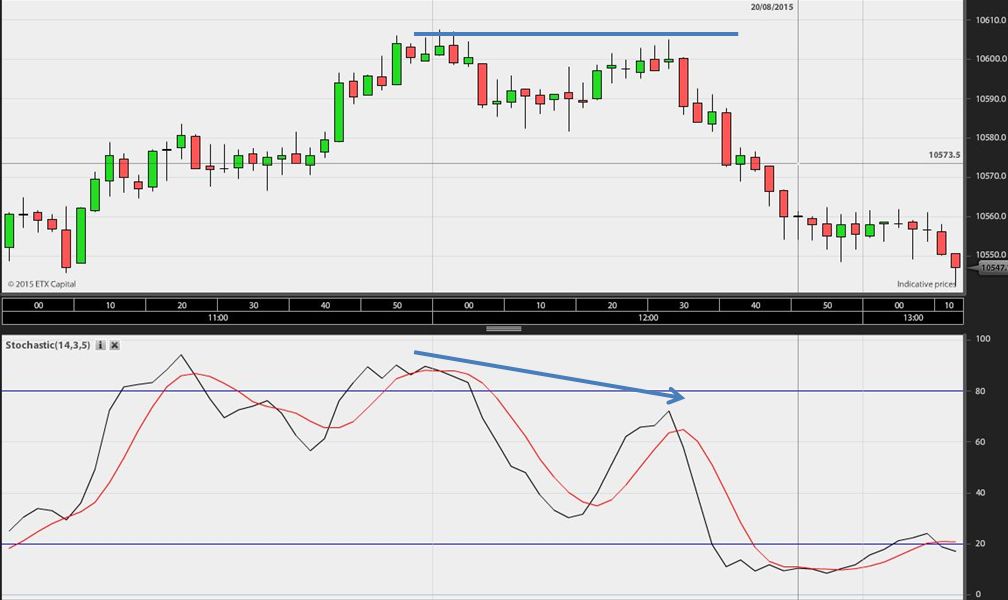
Here is the price for the German DAX index. The price forms a double top between 12 and 12:30, and at the same time, it can be seen that the oscillator at the bottom forms a lower top. Thus, the price development is losing momentum, and this is interpreted by some as a sell signal.
Many traders here will wait for the top formation to be confirmed, so they do not enter the trade too early.
In the screenshot, the black line is %K, and the red line is %D. If one wants to focus only on %D, which is the most important line, one can set %K to be the same color as the background, thereby achieving a more simplified image.
This method of trading stochastics is very common among day traders and swing traders, and it can be good to have in one’s repertoire.