
Double bottoms and double tops are well-known patterns that often occur in financial markets. They frequently appear at the end of a trend, signaling the potential reversal of that trend. These patterns often take the form of a double bottom resembling a large “W” and a double top resembling a large “M.”
Below is an example of the gold price on August 14, 2015, on a 10-minute chart. As you can see, the price rises for most of the morning until around 13:10, after which it reverses and forms a double top at 16:30.
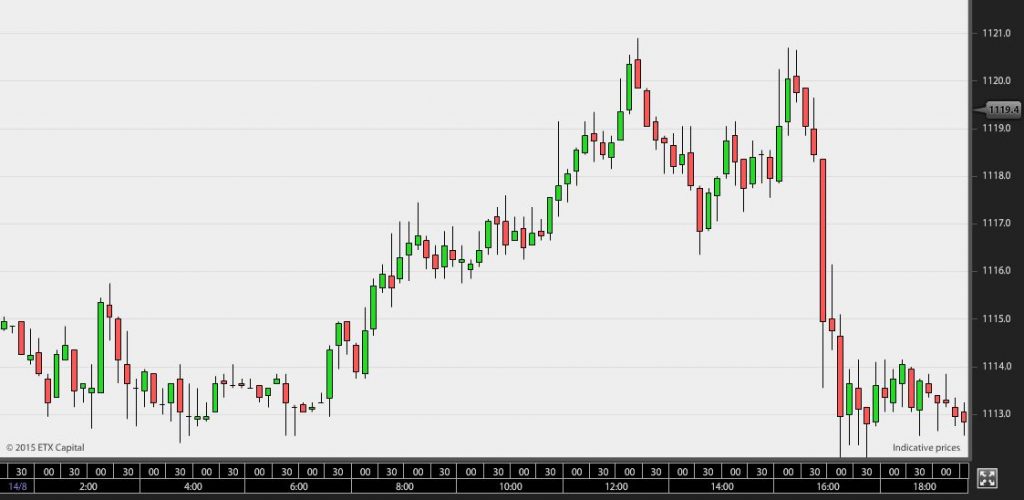
In this example, we see a double-top pattern. These patterns can sometimes be observed at the end of an uptrend. It’s a clear sign that buyers are losing interest and it’s time for sellers to take over. When the second top is confirmed, and the price is heading down, it can be seen as a signal that the price is likely to go even lower.
In the example above, you can see that double tops can take the form of an extended “M,” where you can trade the second leg of the “M” as soon as the movement is confirmed.
However, one should be cautious about blindly trading these double tops and bottoms, as they rarely alone provide enough information to predict a development with a sufficiently high probability. That’s why many day traders choose to complement this pattern with an indicator. For example, it could be the stochastic indicator, which shows momentum in the market.
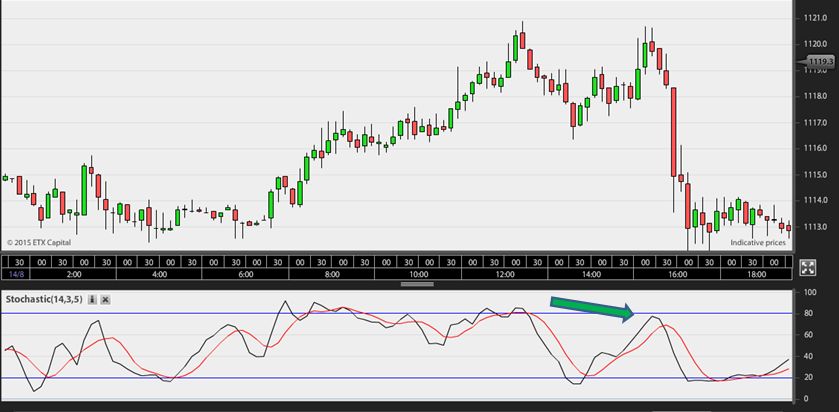
In the screenshot above, it can be seen that the momentum indicator below the price chart forms a lower low. This is indicated by the green arrow. This occurs at the same time as the price forms a double top.
This pattern, where the indicator loses momentum while the price forms a double top or bottom, is also called “divergence” and is used by day traders worldwide.
The above chart is constructed on the ETX Capital platform, where you can set up stochastics by opening a chart, clicking on “studies,” and then selecting “Stochastic.”