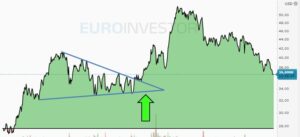
TECHNICAL ANALYSIS

Wedges

Wedges

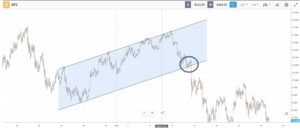
Wedges, like trend channels, are essential for understanding market developments and can trigger both buy and sell signals in the same way as trend channels do. Wedges also resemble pennants – read about pennants here. In the chart below, you can see the price development of Yahoo stock over the…
Continue reading

Trend Channels

Trend Channels

Trend channels are valuable tools for understanding where the market is heading. Often, the market follows these channels, providing a framework to better organize and understand sometimes overwhelming market movements. An upward trend is defined by the chart showing higher and higher peaks at each turn, as well as higher…
Continue reading

Round Numbers

Round Numbers

Round numbers play a significant role in analyzing all types of markets. Just like resistance and support levels, round numbers are often points where the price may halt. Examples of this can be found in the markets every single day. Many financial markets pause at round price levels, such as…
Continue reading

The Fibonacci Sequence

The Fibonacci Sequence

Fibonacci numbers are a widely used – and highly debated – tool for predicting price movements in financial markets. Day traders frequently employ them, though never as the sole indicator. Typically, Fibonacci tools should be combined with other elements of technical analysis to achieve favorable results. This approach ensures a…
Continue reading

12 Candlestick patterns you should know

12 Candlestick patterns you should know

Candlestick charts were invented by Japanese rice traders in the 17th century and were used for trading rice contracts from around 1710 onwards. Fundamentally, these are charts that contain more information than the very classic chart, the line chart, and therefore they also provide an opportunity to read the market…
Continue reading

Falling Knife

Falling Knife

When the stock market falls significantly, it can be especially tempting to buy quickly. You don’t want to miss the “unique” opportunity at a good price, and in the rush, you may forget both your common sense and your normal analyses. In trading, they say you’re trying to “catch a…
Continue reading

Gartley patterns

Gartley patterns

The so-called Gartley pattern is built around a simple ABCD formation but appears slightly more advanced. The Gartley pattern is traded by many professional technical traders who often make their own additions to the classic starting point. One of these traders is the American speculator Larry Pesavento, who has appeared…
Continue reading

Keltner Channels

Keltner Channels

‘Keltner Channels’ is an indicator that measures market volatility. The original Keltner Channels were described by trader Chester Keltner in a book from 1960. However, the indicator has since been modernized, so today it closely resembles the Bollinger Bands© indicator, which is more well-known. Keltner Channels consist of three lines:…
Continue reading

PKS-oscillator

PKS-oscillator

PKS is also known as The Stochastic Slow. It is simply a Stochastic oscillator that is slower than a normal Stochastic. This oscillator compares a product’s most recent closing price with the price range it has moved in over a period. The idea is that a stock appears weak if…
Continue reading

Williams %R

Williams %R

If you want a simple indication of whether a security is overbought or oversold, Williams %R may be the perfect indicator. Williams %R, also known as ‘Williams Percent Range’, is a momentum indicator that compares a stock’s recent closing price with the price range the instrument has moved in over…
Continue reading