
The correlation strategy can help you determine the direction of your swing trades. In the following description, we use the correlation strategy in forex pair trading, but the correlation strategy can also be used for directional analysis across indices, commodities, etc. The correlation strategy involves finding two prices that follow each other over an extended period, and then taking advantage of the periods where the correlation seems to fail. Here, one hopes that the two prices will rediscover their rhythm.
| Try our free forex signal service via Messenger: Click here |
Most day traders trade forex by analyzing the chart of a single forex pair, for example, EURUSD (Euro against dollars) or USDJPY (Dollars against Japanese yen). Whether they should go long or short in the forex pair is determined solely by analyzing the movements on the timeframe they are trading – for example, a 30-minute or hourly chart. However, as a forex trader, the correlation strategy can be used as a strong supplement to select which forex pairs to trade and in which direction a particular forex pair is likely to move soon.
The correlation strategy is approached in the following way: First, you find a correlated forex pair. Here, for example, you can use this page to find a correlated forex pair.
The website provides an overview of the correlation between different forex pairs. If you want to avoid “white noise”, you should choose a correlation on at least a daily basis (see the dropdown menu on the page).
In the overview, a correlation of, for example, 90% means that the prices closely follow each other. 0 means that there is no correlation at all, whereas -90% indicates a high correlation but a negative one – meaning that the charts move in a fairly precise relationship to each other but in opposite directions. When looking for correlation, one should only be interested in anything above 80% or below -80%.
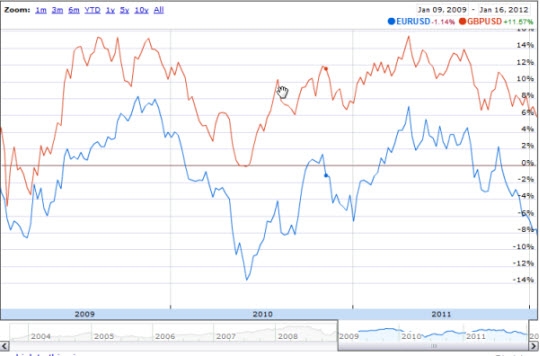
The image on the left shows the correlation between EURUSD and GBPUSD during a period from 2009 to 2012. As you can see, the two charts closely followed each other.
The reason why certain forex pairs correlate with each other is often found in the fact that they have a mutual dependence. In the case of EURUSD and GBPUSD, one can say that they both relate to USD. For example, if unemployment rises in the USA, both exchange rates will likely move either up or down at approximately the same time because both forex pairs are related to US dollars.
The idea behind the correlation strategy is to find forex pairs that have followed each other over an extended period but, for some reason, have fallen out of sync. The hope is that, at some point, the two forex pairs will rediscover their correlation to each other.
| Try our free forex signal service via Messenger: Click here |
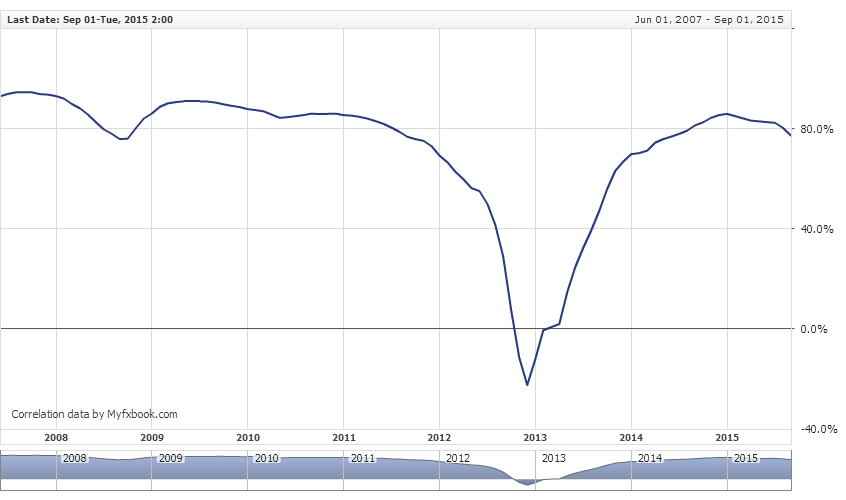
For example, look at the graph below, which shows the correlation between AUDJPY and GBPJPY on a monthly chart. From 2008 to 2010, the charts correlated at around 80%, after which the correlation took a sharp dive and the two forex pairs rediscovered correlation in 2014. The expectation now could be that the correlation will continue for an extended period, just as it happened from 2008 to 2010. If one believes in this, the small dip below 80% at the end of the period (September 2015) can be used to look for a trade. In other words, one trades on the expectation that the correlation will quickly rise above 80% again.
But how do you exploit this expectation?
To gain more insight into how to trade, you can compare the charts of the two pairs against each other. You can do this, for example, by using this page: https://www.myfxbook.com/forex-charts/nc. Find the dropdown menu labeled “compare.” By entering AUDJPY and GBPJPY, you can see that the two charts have indeed lost some correlation with each other (see the graph below). For the charts to converge again, GBPJPY, represented by the blue line, needs to move downward, while the red line representing AUDJPY needs to move slightly upward.
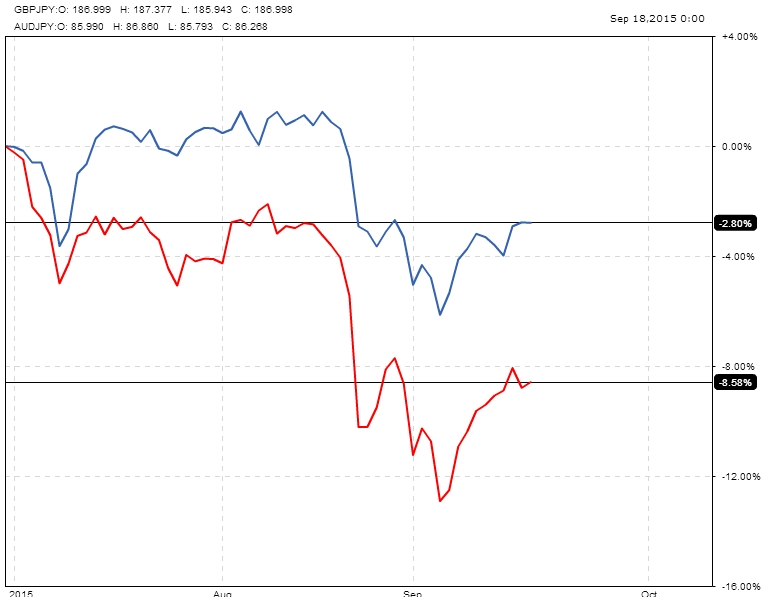
This does NOT mean that you should simply short GBPJPY and go long on AUDJPY, as you would then expose yourself to double the risk. Instead, you should go directly to the heart of the matter, namely the currency pair GBPAUD. The reasoning for this is that if the British pound is seemingly becoming weaker against the Japanese yen, and the Australian dollar is becoming stronger against the Japanese yen – well, then you can exclude the Japanese yen from the equation and trade GBPAUD directly against each other.
Since the conclusion of the analysis was that the pound should weaken to restore correlation and Australian dollars should strengthen to restore correlation, you simply short the currency pair GBPAUD.
Exactly when to short depends entirely on the day trading strategy used for entries. With the correlation strategy, you’ve only gained an idea of where the currency pair is likely headed in the slightly longer term. The actual entry should be approached with a more short-term plan. Always remember that there can be many bumps along the way toward the goal.
The correlation strategy doesn’t only work on forex pairs. It can also be used for forex pairs against indices or indices against commodities. For example, gold or oil. There are mutual relationships in a wide range of securities.