
The stochastic oscillator – also called stochastics – is one of the most recognized indicators for assessing market direction in technical analysis. The stochastic oscillator is a technical indicator that enables a trader to estimate the end of a trend as well as the beginning of another trend. Before starting to use the stochastic oscillator, however, it is important to find out what the indicator consists of, and how to use it to get an idea of the market’s turning points.
| Try our free forex signal service via Messenger: Click here |
What is a stochastic oscillator?
The stochastic oscillator is a momentum indicator that compares the latest closing price to the previous trading range over a certain period. Unlike other oscillator indicators, the stochastic oscillator is not based on price or volume, but rather on the speed and velocity of the market.
The stochastic oscillator was developed by George C. Lane in the late 1950s. His theory was based on the idea that the market’s momentum would change direction much faster than volume and price increases. This means that the stochastic oscillator can be used to estimate price movements and thereby improve a trader’s decisions. For this reason, the stochastic oscillator is considered a leading and frequently used indicator.
How is the oscillator calculated?
The stochastic oscillator is formed by two lines on a price chart, called the indicator line (%K) and a signal line (%D).
If one wishes to calculate the indicator line manually, this can be done by subtracting the lowest price for the period from the most recent closing price. Then, divide the result by the highest price in the period subtracted by the lowest price. The formula for the stochastic oscillator is as follows:
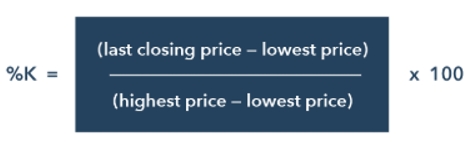
The indicator line (%K) is normally calculated based on a 14-day period, while the signal line is a three-day simple moving average (SMA) of the indicator line.
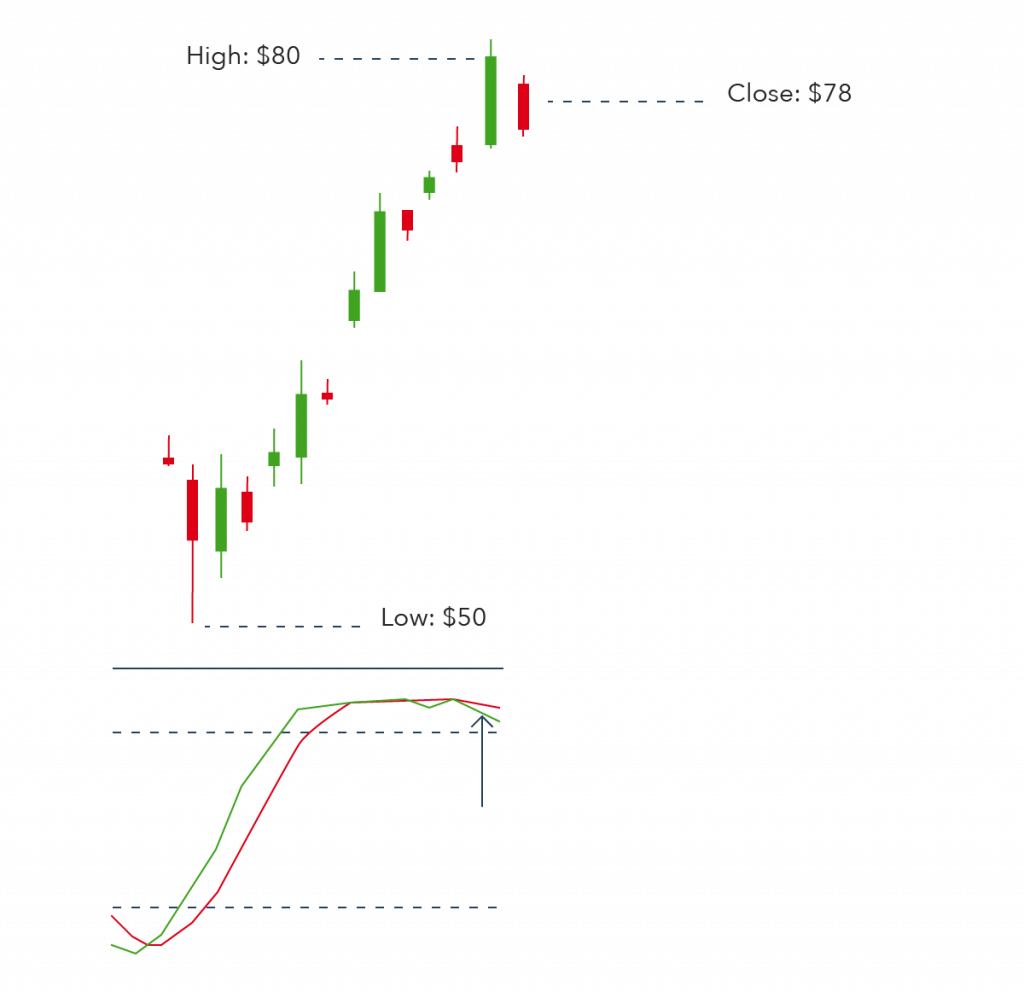
Let’s imagine the price of company XYZ. The following chart indicates the price of XYZ and consists of so-called candlesticks. The chart shows a 14-day period, where each bar indicates the lowest and highest price on each trading day. We can see that the lowest price in the period was at 50 USD, while the highest price was reached at 80 USD. The most recent closing price of XYZ was close to the highest price level, namely at 78 USD. This means that the indicator line would be calculated as follows: [(78-50)/(80-50) x 100] = 93.3%.
How to use the stochastic oscillator
Before starting to use the stochastic oscillator, it’s important to understand exactly what the indicator actually displays.
The stochastic oscillator is a so-called bounded mean oscillator, which means it operates on a scale from 0 to 100. This scale represents an asset’s/instrument’s total trading range within the period (the 14 days in the example above), and the final percentage shows where the most recent closing price lies within that range. This makes it easy to identify overbought and oversold signals.
If the indicator line is above 80%, the price is considered ‘overbought,’ while a reading below 20% would indicate that the underlying asset is viewed as ‘oversold’. According to stochastic oscillator theory, an oversold or overbought market implies that the price is likely to reverse soon.
As described above, the stochastic oscillator consists of two lines, including the indicator line (%K) and the signal line (%D). When these two lines cross each other, it’s a sign that a change in market direction is approaching. If the indicator line (%K) crosses the signal line (%D) from below, a buy signal would occur – unless the values are above 80. Conversely, it is seen as a sell signal if the indicator line (%K) crosses the signal line (%D) from above – unless the values are below 20.
Although the indication of overbought and oversold can be a good tool to have when trading, it is always important to remember that overbought and oversold readings are not very accurate indications of a reversal. For example, the stochastic oscillator may show that the market is overbought, while the asset may remain in a strong uptrend if there is sustained buying pressure. This is often seen during market bubbles, where periods of increased speculation arise, causing an asset’s price to reach consistently higher levels.
It is therefore advisable to combine the readings from the stochastic oscillator with other technical analysis indicators.

Bullish and bearish divergences
The most common use of the stochastic oscillator is to identify so-called bullish and bearish divergences – that is, points where the oscillator and market price show different signals – as this is usually a sign that a reversal is expected soon.
| Try our free forex signal service via Messenger: Click here |
A bullish divergence occurs when the price records a ‘lower low’, while the stochastic oscillator forms a ‘higher low’. This event means that the downward momentum is decreasing, which could indicate a potential ‘bullish reversal’. Conversely, a bearish divergence is formed when the market price achieves ‘higher highs’, while the stochastic oscillator forms ‘lower highs’, indicating falling upward momentum and the possibility of a ‘bearish reversal’.
Bull and bear set-ups
The founder of the stochastic oscillator, George Lane, believed that divergence could also be used to predict bottoms and tops in the market. He referred to this as a ‘bear set-up’ and ‘bull set-up’, as the stochastic oscillator would reach a top or bottom preceding the market’s change in direction. In this way, one can predict with some probability whether there is still bullish or bearish momentum in the market, even if the price does not achieve a ‘higher high’.
A ‘bull set-up’ is the opposite of a bullish divergence, as it occurs when the market price forms a ‘lower high’, while the stochastic oscillator makes a ‘higher high’. The price of the asset thus does not make a new ‘high’, but the optimism from the indicator signals that the upward momentum is still strengthening.
In the same way as with a ‘bull set-up’, a ‘bear set-up’ occurs as the inverse of a bearish divergence. This happens when the market price forms a ‘higher low’, while the stochastic oscillator makes ‘lower lows’. Even though the price of the asset did not manage to break through the last ‘low’, the indicator shows that there is still increasing downward momentum.
Stochastic oscillator vs RSI
The stochastic oscillator and relative strength index (RSI) are both momentum oscillators, used to identify overbought and oversold conditions in the market.
Although both are used for the same purpose, they are based on very different theories. The stochastic oscillator is based on the idea that closing prices remain close to historical closing prices, while RSI attempts to track the speed of the trend.
Similarly, both oscillators operate on a scale from 0 to 100, but RSI already indicates that the market is overbought if it exceeds 70, while the stochastic oscillator must reach 80. Conversely, RSI will suggest that the underlying asset is oversold if the indicator is below 30, while the stochastic oscillator must drop to 20.
Conclusion
How you deploy the stochastic oscillator will depend on your personal preferences, trading style, and goals. However, all the above points are key points that anyone using this momentum indicator should be aware of.