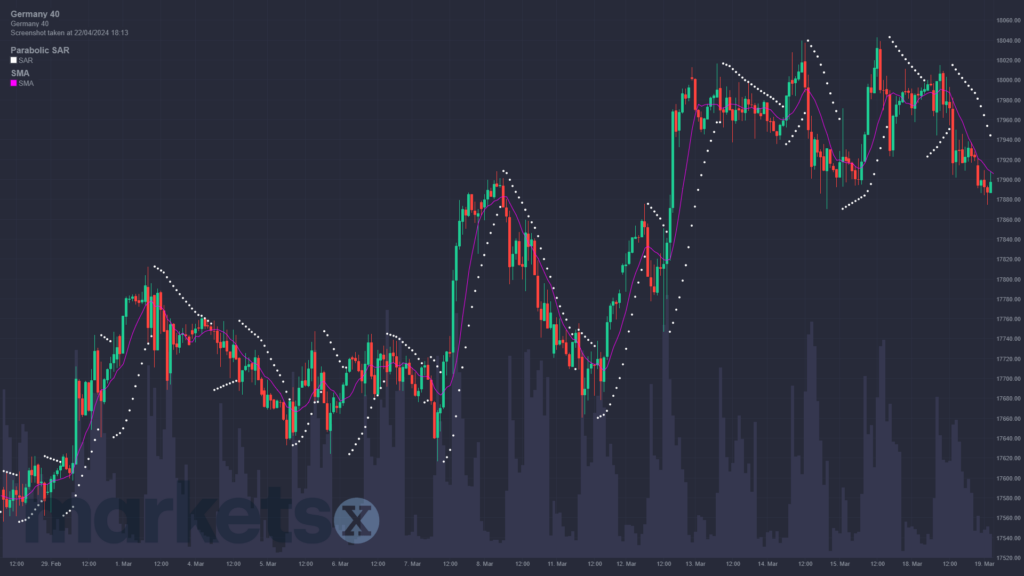
Parabolic SAR (also called PSAR) is not a particularly widespread indicator among Nordic traders, which is a pity because the indicator can provide some exceptionally strong signals in a directional market, and the indicator is relatively easy to understand. At the same time, the indicator is ideal for use in conjunction with other well-known indicators, for example, moving averages (EMA).
Parabolic SAR is often used to identify a new movement in a market that is already trending. As a trader, one can enter early into such markets and make the most out of the continued trend.
| Try our free forex signal service via Messenger: Click here |
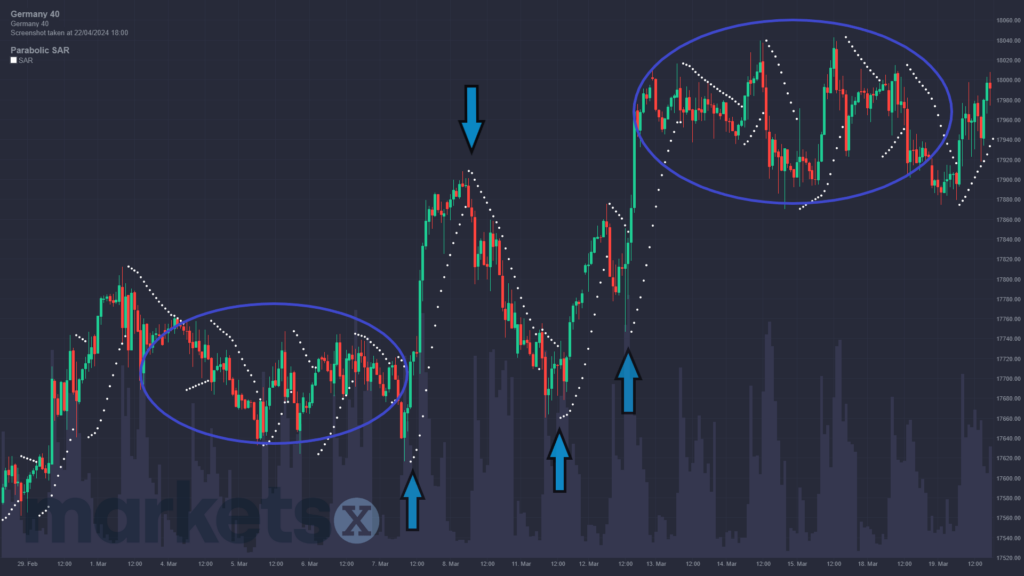
The characteristics of the indicator are a series of dots placed either above or below the price chart. If they are placed above the asset’s price, Parabolic SAR signals that it is a bear market (downward market), whereas it indicates an upward market if the dots are placed below the price. One can imagine that the dots act as a kind of ‘ceiling’ or ‘floor’ in relation to the price, where the price thus has difficulty moving above or below, and in this way, the indicator can be easy to understand for untrained traders.
For traders looking for a reversal, particular attention should be paid when the dots from the Parabolic SAR change – for example, from being under the chart to suddenly being above the chart. This indicates a change in direction, and here the trader will typically seek confirmation from other indicators or from other time intervals to ensure that a reversal is indeed occurring. See the following chart examples if you want an impression of how PSAR can be used.
Parabolic SAR was developed by the famous technical trader Welles Wilder, who is also behind the RSI indicator, one of the most used indicators overall. The calculation behind Parabolic SAR is relatively complex, but as a trader, you do not need to fully understand this. Most trading platforms automatically draw the indicator on the chart if selected. Parabolic SAR looks at the lowest or highest price of the period, and in each of the following periods, the acceleration factor in the chart trend is assessed. If the acceleration stalls and the price goes above or below the previous period’s highest/lowest point, the direction of the indicator changes and the indicator’s dots switch from top to bottom or vice versa.
Various studies have shown that the correct use of PSAR can actually provide a significant advantage compared to just holding a stock over time.