mean reversal trading

The pullback strategy

The pullback strategy

As an active trader, you are always on the lookout for a strategy that works. Often, you end up having your trading screen filled with a jumble of lines and advanced indicators. But maybe it doesn’t have to be so complicated. The active trader, blogger, and analyst Joe Marwood has…
Continue reading

Stochastic strategies

Stochastic strategies

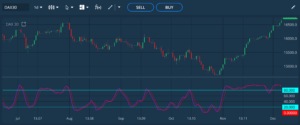
The stochastic oscillator – also called stochastics – is one of the most recognized indicators for assessing market direction in technical analysis. The stochastic oscillator is a technical indicator that enables a trader to estimate the end of a trend as well as the beginning of another trend. Before starting…
Continue reading

Stochastic Oscillator

Stochastic Oscillator

The stochastic oscillator – also known as stochastics – is one of the most recognized indicators for assessing momentum in technical analysis. The idea behind this indicator is that in an uptrend, the price should close near the highest point of the range in which it moves in each period.…
Continue reading

RSI

RSI

The Relative Strength Index or RSI is a momentum indicator that compares the magnitude of recent gains to recent losses over a period. RSI is usually used to assess whether a market is overbought or oversold. If you calculate RSI on a daily chart, it is done using the following…
Continue reading

Bollinger Bands

Bollinger Bands

Bollinger Bands® is an indicator that measures market volatility. Bollinger Bands® was invented by the technical analyst John Bollinger in the 1980s, and he obtained trademark protection for the indicator in 2011. Bollinger Bands® consists of three lines: A middle line and an upper and lower line, often encapsulating the…
Continue reading

MACD Indicator

MACD Indicator

The MACD indicator is one of the most used indicators in understanding market development. The indicator is based on moving averages and their interrelationship. MACD is an abbreviation for Moving Average Convergence Divergence. The MACD indicator is based on three different time parameters, namely time constants for three moving averages.…
Continue reading

Parabolic SAR

Parabolic SAR

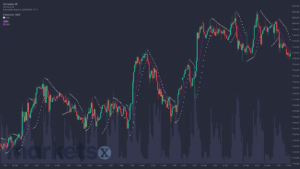
Parabolic SAR (also called PSAR) is not a particularly widespread indicator among Nordic traders, which is a pity because the indicator can provide some exceptionally strong signals in a directional market, and the indicator is relatively easy to understand. At the same time, the indicator is ideal for use in…
Continue reading