
Many trading platforms include a technical tool called Andrews Pitchfork. It is a tool for technical analysis that can help analyze a trend. It was invented by the trader Alan Andrew, presumably sometime in the 1930s. Andrew was a student under the famous Roger Babson, who made a fortune during the Wall Street crash of 1929.
Andrews Pitchfork gets its name because the tool draws three lines that together resemble a “pitchfork” with a median line and two outer parallel lines at a certain distance from the median line. If you find a price development where you can draw a valid pitchfork, according to Andrew, you can predict the price development with a certain probability.
| Try our free forex signal service via Messenger: Click here |
The potential for a Pitchfork model occurs when the price follows a trend (down or up), then the price corrects, and thereafter it continues in the direction of the preceding trend.
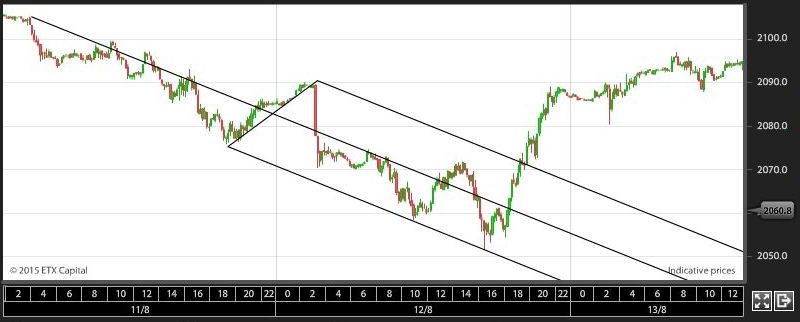
In Figure 1, you see a valid pitchfork on the 10-minute chart of the S&P 500 index. It is valid because the chart appears to respect the lines in the graph. The starting point for this pitchfork is the top of the chart around 4:00 AM on August 11th. The price falls in a parallel channel until about 6:00 PM the same day, where a correction occurs until 2:00 AM on the night of August 12th. These three points form the basis for drawing Andrews Pitchfork. Notice how the peaks and troughs to a certain degree respect the median and the lower line going forward.
Alan Andrew made several predictions in connection with his model:
- 80% of the time, the price will hit the median line. This occurs around 2:00 AM in Figure 1.
- When the price hits the median line, it can either be pushed back towards the outer line again or cut straight through. In Figure 1, it cuts straight through.
- If the price goes through the median line, it will typically make a short retracement and test the median line again. This also happens in Figure 1 around 6:00 AM on August 12.
- If the price fails to reach one of the outer lines, it will turn sharply and at least reach down to the median line again. This also happens in Figure 1 around 2:00 PM on August 12.
- The price will often reverse at the outer lines. This occurs around 10 AM and 3 PM in Figure 1.
- If the price cuts through the outer lines, it indicates a trend change. This happens around 7:00 PM in Figure 1.
As a trader, you can use these six rules to try to enter a trade in the direction of the trend. This approach can be extremely effective.
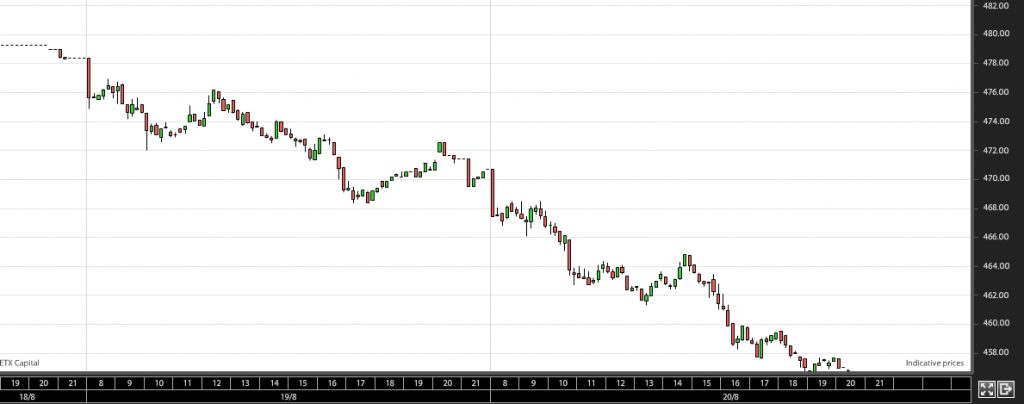
Let’s consider another example. In Figure 2, the price in the Dutch AEX index is shown. The trend is clearly downward. Around 4:00 PM on August 19, a minor correction occurs. This uptrend appears to be broken again at 8:00 PM.
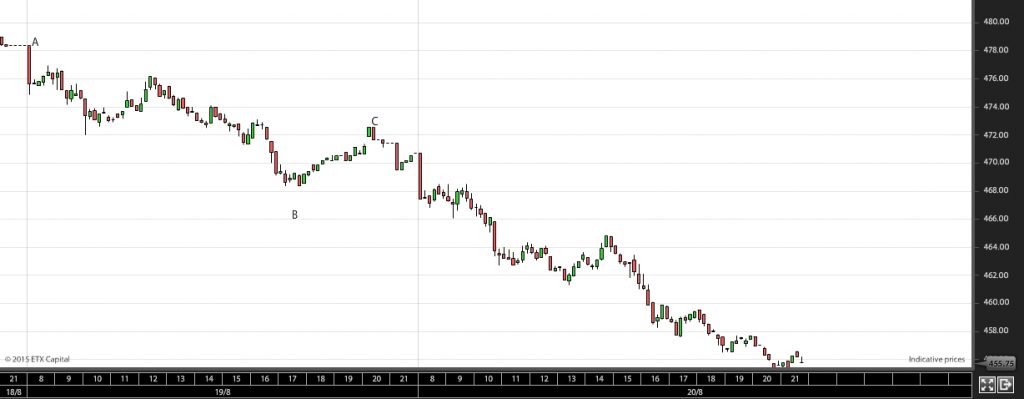
Now draw Andrews Pitchfork from the top of point A to the bottom of point B and up to the top of the correction C. Figure 3.
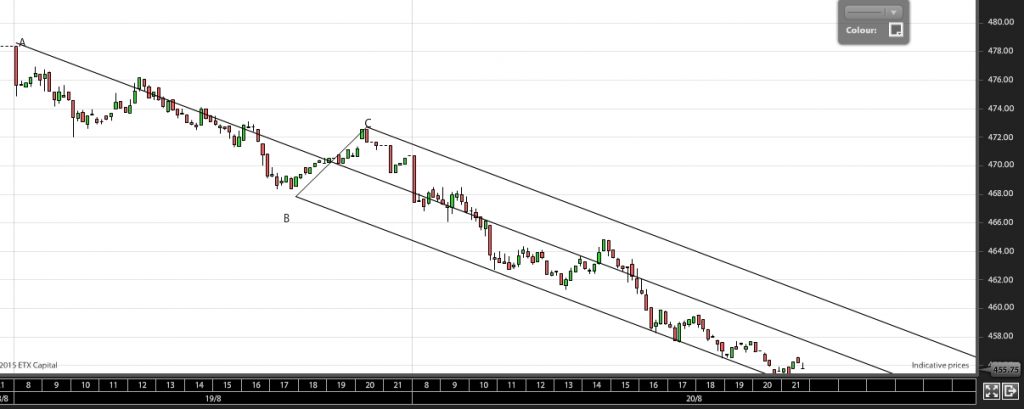
It will look like Figure 4. Notice how the price then follows several of the rules outlined from point 1-6.
In the video below you can watch the legendary Alan Andrew himself.