11 January 2024

Gartley patterns

Gartley patterns

The so-called Gartley pattern is built around a simple ABCD formation but appears slightly more advanced. The Gartley pattern is traded by many professional technical traders who often make their own additions to the classic starting point. One of these traders is the American speculator Larry Pesavento, who has appeared…
Continue reading

Island Reversal

Island Reversal

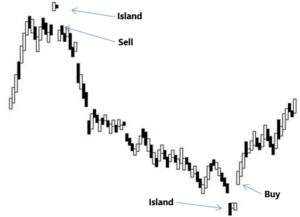
Normally, liquid stock prices appear continuous and smooth because sellers and buyers are constantly in line to bid at the current price. But occasionally, a phenomenon occurs in the stock price where the price ‘jumps’ so much up or down that a break in the graph occurs, where the new…
Continue reading

PEAD strategy

PEAD strategy

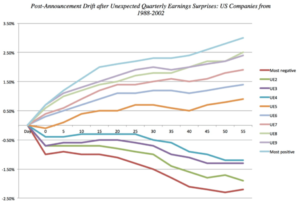
There is always excitement when the earnings season approaches and individual companies are to ‘reveal’ their bottom lines. Often, the price moves sharply up or down if the earnings surprise analysts. As a trader, it can be difficult to trade during the earnings season. Still, there is a sound trading…
Continue reading

Pivot strategy

Pivot strategy

This daytrader strategy, in brief, consists of a moving average and seven so-called pivot lines. The trade is initiated when a specific pivot line is breached, and the trade is stopped again when the price crosses the moving average. The pivot lines constitute some extremely important price levels in most…
Continue reading

Stable morning trend

Stable morning trend

As a day trader, you constantly dream of being able to predict current trends in the stock market. Is the market going up or down? If you believe in the former, you usually need to hurry to buy into the major stock indices in the morning, and then lean back…
Continue reading

Trend following

Trend following

Many traders use the expression ‘The trend is your friend’, and there is much truth in that. Beginners in trading dream of ‘catching the turns’, thereby reaping the full benefit of a trade by buying exactly at the low point and selling exactly at the maximum profit. But if you…
Continue reading

Moving Average

Moving Average

Moving averages are one of the most fundamental tools in technical analysis. Among other uses, moving averages can be used to determine the trend in a market, whether it is upward, downward, or moving sideways. Looking at a moving average over the last 50 hours provides a long perspective for…
Continue reading

Williams %R

Williams %R

If you want a simple indication of whether a security is overbought or oversold, Williams %R may be the perfect indicator. Williams %R, also known as ‘Williams Percent Range’, is a momentum indicator that compares a stock’s recent closing price with the price range the instrument has moved in over…
Continue reading

Stochastic strategies

Stochastic strategies

The stochastic oscillator – also called stochastics – is one of the most recognized indicators for assessing market direction in technical analysis. The stochastic oscillator is a technical indicator that enables a trader to estimate the end of a trend as well as the beginning of another trend. Before starting…
Continue reading

PKS-oscillator

PKS-oscillator

PKS is also known as The Stochastic Slow. It is simply a Stochastic oscillator that is slower than a normal Stochastic. This oscillator compares a product’s most recent closing price with the price range it has moved in over a period. The idea is that a stock appears weak if…
Continue reading