Many traders use the expression ‘The trend is your friend’, and there is much truth in that. Beginners in trading dream of ‘catching the turns’, thereby reaping the full benefit of a trade by buying exactly at the low point and selling exactly at the maximum profit. But if you want to be successful as a trader, you should forget that dream immediately. Achieving maximum profit in a price cycle is almost impossible. Instead, one can more successfully try to locate a trend, and then ride the wave.
| Try our free forex signal service via Messenger: Click here |
To locate a trend and a possible entry, you can use the following strategy, which is called the ‘Trend following strategy’.
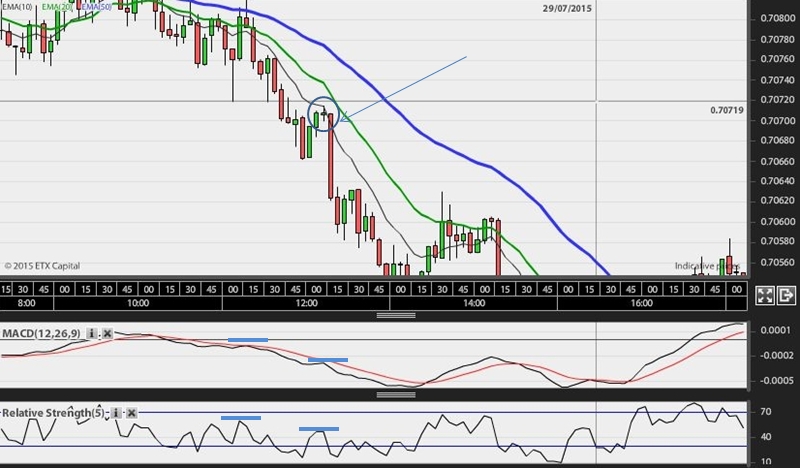
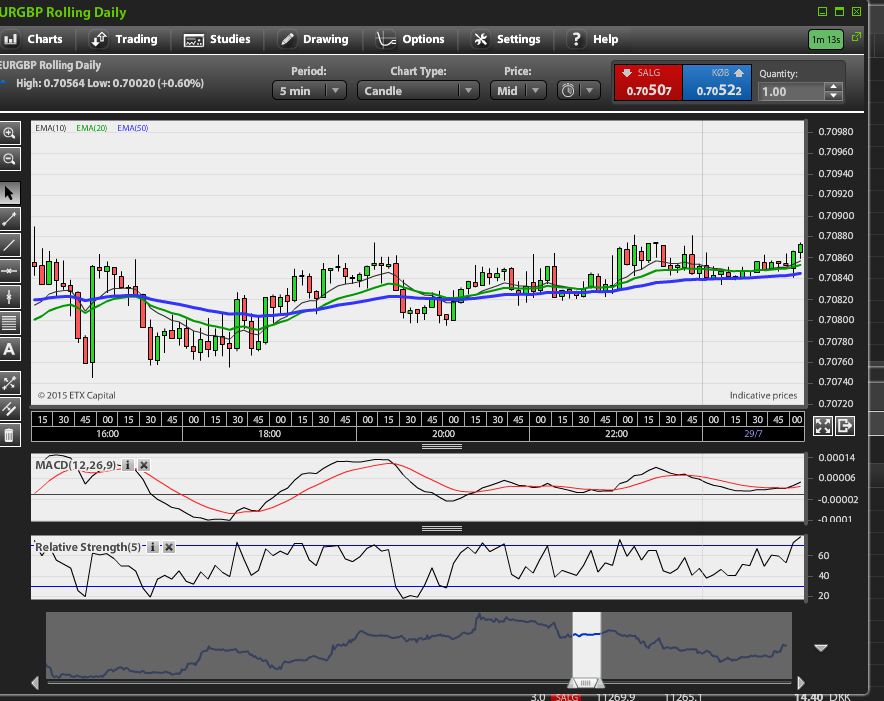
A. To be sure that you are in a trending market, you can apply three different moving averages to your chart (as a day trader, for example, you can use a 5-minute chart). The EMAs should have three different speeds: 10, 20, and 50. When you see that the three EMAs are aligned with each other, you know you are in a trending market. As extra security, you can supplement your 5-minute chart with a 15-minute or 30-minute chart and similarly apply the three EMAs to the chart. If the longer timeframe shows the same trend, then the trend is going strong. See Figure 1.

B. To determine the momentum in a trend, i.e., how strong the trend is, you can use the indicators RSI and MACD. Momentum is an expression of the buying pressure in an uptrend and the selling pressure in a downtrend. To be sure that we have a solid trend, we want new ‘highs’ on the price chart to also show as new ‘highs’ on RSI and MACD.
If points A and B are fulfilled, you can be reasonably sure that you are in an uptrend. Now you just need to find a good entry point in the market.
Notice how a market, even though it is trending, is still adjusted along the way with small ‘pullbacks’. It is the trader’s task to buy these pullbacks in order to get the best possible price. Typically, you can wait for the price to move down between the fast and the medium-fast moving average

When you see this pullback, you should wait for a small so-called ‘trigger candle’. This means a small candle that confirms the market has slowed down and is now waiting to decide to continue in the direction of the trend.
Your precise entry now occurs when the next candle surpasses the small trigger candle in the direction of the trend.
