The ABCD pattern is one of the most well-known patterns in technical trading. In a more advanced form, it is also known as Gartley patterns. The ABCD pattern describes a correction in the market with a wave formation either in a downward or upward direction. When the formation is completed, as a trader, you should look to go “long” if it’s a downward ABCD correction or go “short” if it’s an upward ABCD correction.
The pattern was first described in the book “Profits in the Stock Market” written by H.M. Gartley back in 1935. The book described a pattern called AB=CD. The pattern was later further discussed in the book “The Frank Tubbs Stock Market Course” from the 1950s and again in 1976 in the book “A Trading Strategy” by Charles Lindsay.
| Try our free forex signal service via Messenger: Click here |
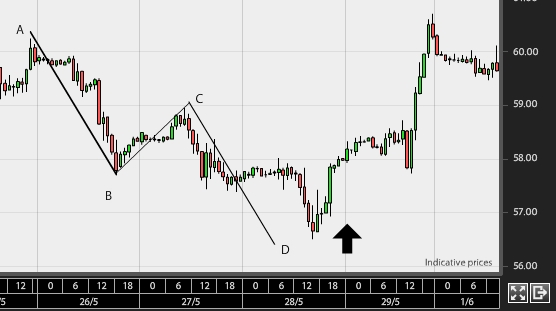
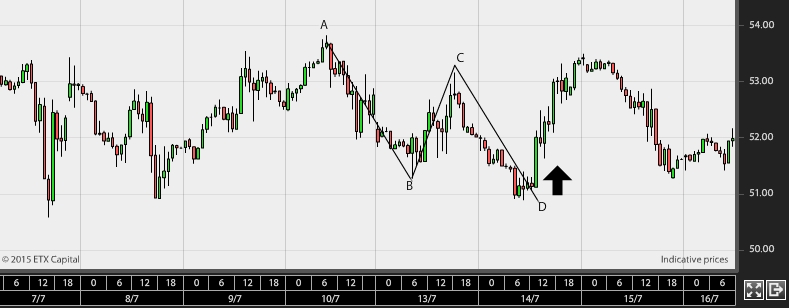
The ABCD pattern can be found in all markets and in all timeframes. In its classic form, the pattern looks like this:
The pattern must meet the following rules to be considered a classic ABCD correction:
- The length of the first trend AB is equal to the length of the last trend CD.
- The length of the correction BC cannot be longer than the length of AB.
- Point C must not be higher/lower than the starting point A.
- Point D must be higher/lower than point B.
When the entire pattern is completed, the trader expects that the price will move in the opposite direction of the recent trend, from point C to point D.
If you want to trade based on the ABCD pattern, it’s essential that the direction is supported by other technical indicators. These could include resistance points, double bottoms, channels, trends, or Fibonacci levels. There are more complex variations of the ABCD pattern, such as Gartley patterns, which are backed by Fibonacci levels and are described on a separate page.