christian

christian

Post by: christian

12 Candlestick patterns you should know

12 Candlestick patterns you should know

Candlestick charts were invented by Japanese rice traders in the 17th century and were used for trading rice contracts from around 1710 onwards. Fundamentally, these are charts that contain more information than the very classic chart, the line chart, and therefore they also provide an opportunity to read the market…
Continue reading
COT Strategy

COT Strategy

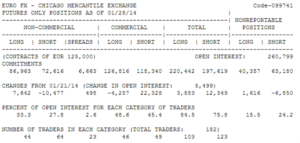
The CoT indicator is a useful tool for trading forex, which surprisingly is only used by a small number of traders. The indicator is based on the reports published by the Commodity Futures Trading Commission (CFTC) every Friday. The CFTC report can be used by traders to identify potential significant…
Continue reading

Stable morning trend

Stable morning trend

As a day trader, you constantly dream of being able to predict current trends in the stock market. Is the market going up or down? If you believe in the former, you usually need to hurry to buy into the major stock indices in the morning, and then lean back…
Continue reading

Correlation strategy

Correlation strategy

The correlation strategy can help you determine the direction of your swing trades. In the following description, we use the correlation strategy in forex pair trading, but the correlation strategy can also be used for directional analysis across indices, commodities, etc. The correlation strategy involves finding two prices that follow…
Continue reading

Fakemove

Fakemove

This strategy is based on the expectation that the price of gold often moves quickly up or down, after which the price levels out again within a few minutes or at most 1-2 hours. We’ve named the strategy “Fakemove” because these movements in gold can be considered “fake moves” –…
Continue reading

Falling Knife

Falling Knife

When the stock market falls significantly, it can be especially tempting to buy quickly. You don’t want to miss the “unique” opportunity at a good price, and in the rush, you may forget both your common sense and your normal analyses. In trading, they say you’re trying to “catch a…
Continue reading

How to find a stock rocket

How to find a stock rocket

Do you often dream of having bought a stock before a significant price increase? Well, there’s good news for you here because in this article, we present a thoroughly tested strategy that helps you get into a stock before a potential explosion in its price. Let’s look at how, using…
Continue reading

Gartley patterns

Gartley patterns

The so-called Gartley pattern is built around a simple ABCD formation but appears slightly more advanced. The Gartley pattern is traded by many professional technical traders who often make their own additions to the classic starting point. One of these traders is the American speculator Larry Pesavento, who has appeared…
Continue reading

Island Reversal

Island Reversal

Normally, liquid stock prices appear continuous and smooth because sellers and buyers are constantly in line to bid at the current price. But occasionally, a phenomenon occurs in the stock price where the price ‘jumps’ so much up or down that a break in the graph occurs, where the new…
Continue reading

Keltner Channels

Keltner Channels

‘Keltner Channels’ is an indicator that measures market volatility. The original Keltner Channels were described by trader Chester Keltner in a book from 1960. However, the indicator has since been modernized, so today it closely resembles the Bollinger Bands© indicator, which is more well-known. Keltner Channels consist of three lines:…
Continue reading