christian

christian

Post by: christian

Williams %R

Williams %R

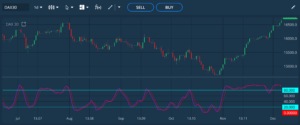
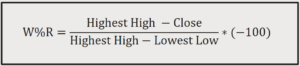
If you want a simple indication of whether a security is overbought or oversold, Williams %R may be the perfect indicator. Williams %R, also known as ‘Williams Percent Range’, is a momentum indicator that compares a stock’s recent closing price with the price range the instrument has moved in over…
Continue reading

Stochastic Oscillator

Stochastic Oscillator

The stochastic oscillator – also known as stochastics – is one of the most recognized indicators for assessing momentum in technical analysis. The idea behind this indicator is that in an uptrend, the price should close near the highest point of the range in which it moves in each period.…
Continue reading

AvaTrade Review

AvaTrade Review

AvaTrade is an EU-based broker, licensed in Ireland. Since 2006, AvaTrade has provided hundreds of thousands with the opportunity to trade CFD contracts at competitive prices and high security. There are several reasons to consider AvaTrade: You can create an account here or read more below in our detailed review…
Continue reading

Get started with Forex trading

Get started with Forex trading

Currency trading is often referred to as forex or FX trading. If you have not heard of currency trading before, it is essential that you read this article thoroughly. Even if you don’t understand all the concepts 100%, it’s important to be familiar with them. If you feel unsure, you…
Continue reading

RSI

RSI

The Relative Strength Index or RSI is a momentum indicator that compares the magnitude of recent gains to recent losses over a period. RSI is usually used to assess whether a market is overbought or oversold. If you calculate RSI on a daily chart, it is done using the following…
Continue reading

Bollinger Bands

Bollinger Bands

Bollinger Bands® is an indicator that measures market volatility. Bollinger Bands® was invented by the technical analyst John Bollinger in the 1980s, and he obtained trademark protection for the indicator in 2011. Bollinger Bands® consists of three lines: A middle line and an upper and lower line, often encapsulating the…
Continue reading

Bullish Engulfing

Bullish Engulfing

The simpler, the better. That’s often the case with trading strategies. Here is an example of a strategy that can yield a strong return if you enter the market correctly. The strategy has been backtested with good results. We have tested it on 2-, 5-, and 30-minute charts in Dow…
Continue reading

Fading the zeros

Fading the zeros

This strategy was coined by the American forex trader Kathy Lien. The technique involves identifying areas in a currency pair where the price approaches a “double zero,” such as 0.7200 in NZDUSD or 1.1200 in EURUSD. The idea is that these areas represent natural support or resistance for thousands of…
Continue reading

Candlesticks

Candlesticks

Candlestick charts were invented by Japanese rice merchants in the 17th century and were used to trade rice contracts from around 1710 onwards. Fundamentally, these are charts that contain more information than the classic chart, the line chart, and therefore also offer the possibility of reading the market in a…
Continue reading

5-1-Daytrading strategy

5-1-Daytrading strategy

The 5-1 strategy was developed by the Danish day trader Hans-Henrik Nielsen from Markettimer, known for his simple yet effective strategies. The 5-1 strategy is a distinct day trading strategy. It can be used in its simplest form, but it can also be advantageously refined with additional indicators. The strategy…
Continue reading