
The simpler, the better. That’s often the case with trading strategies. Here is an example of a strategy that can yield a strong return if you enter the market correctly.
| Try our free forex signal service via Messenger: Click here |
The strategy has been backtested with good results. We have tested it on 2-, 5-, and 30-minute charts in Dow Jones, DAX, and FTSE, where we get consistent results regardless of the market and timeframe. Consider only trading within the specific stock exchange’s trading hours, as the signals in that case are more reliable due to the high liquidity.
Do as follows:
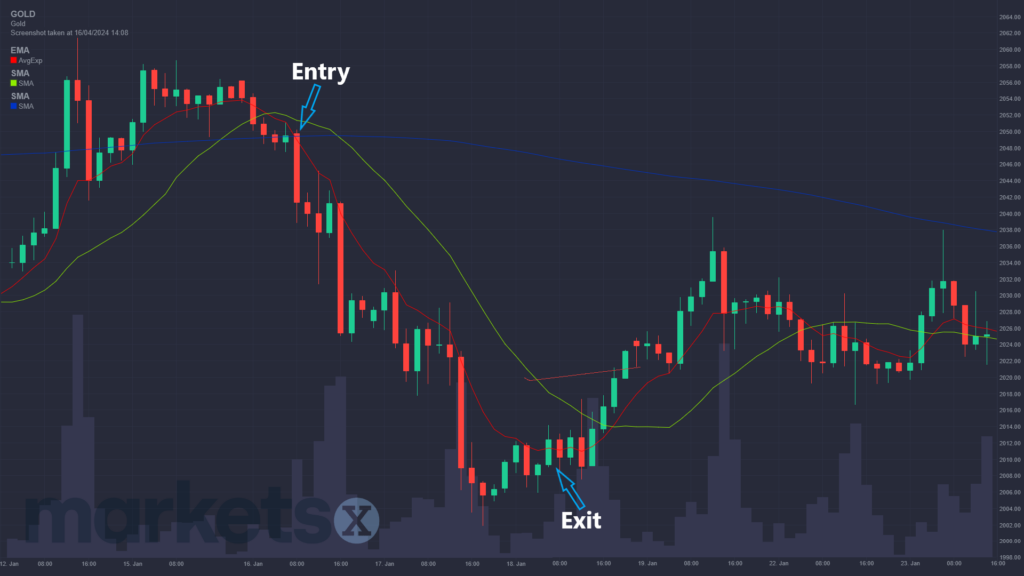
- Find a market with a clear trend. The direction does not matter, as the strategy works both when you go long and short and on all timeframes. In this example, we use a 4-hour chart on gold.
- Apply the following indicators: Simple Moving Average, SMA 20, which is a regular moving average, and Exponential Moving Average EMA 8. In this example, we have chosen a green color for SMA 20 and a red color for EMA 8.
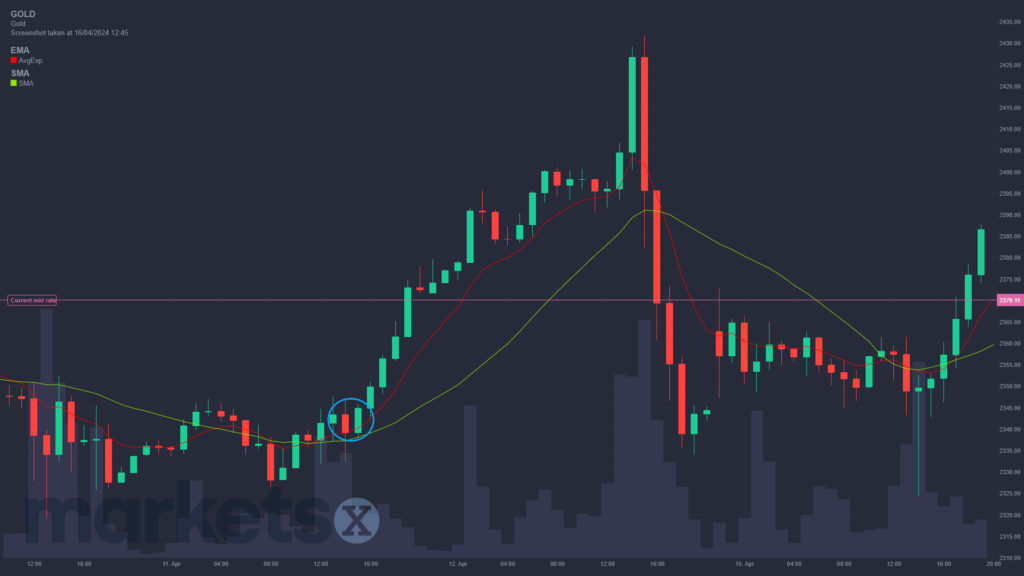
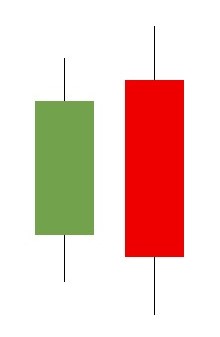
The gold market is trending upwards here. When the market makes a so-called pullback, i.e., it temporarily retreats, for example, after a large increase, one should look for a candlestick pattern that resembles the one in the picture below. Look for this pattern when the price is in the region around the red and green lines.
This candlestick pattern is called ‘bullish engulfing’ and is defined by the second candle being green, and its body being larger than, and thus ‘engulfing’, the body of the preceding candle. This indicates continued strength, and that the market potentially will continue upwards. On the gold chart above, we have marked a bullish engulfing candle with an arrow.
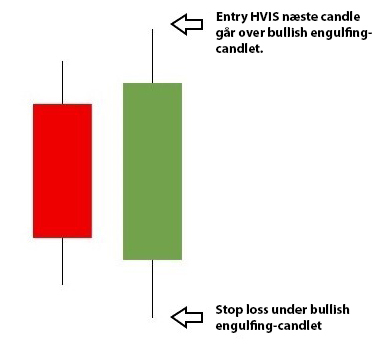
You go long in the market if the subsequent candle goes above the bullish engulfing candle, which it does in this case. You set your stop loss just below the bullish engulfing candle. See the image on the right. Now you are in the market and have the opportunity to follow the upward trend.
When to sell
This is one of the most difficult aspects of trading. Many sell their positions too early because they want a quick profit, while others hold on too long with the hope that the market will continue to rise, only to watch it fall instead. It is important to accept that you will not consistently be able to sell at the top, just as you will not consistently be able to buy at the bottom.
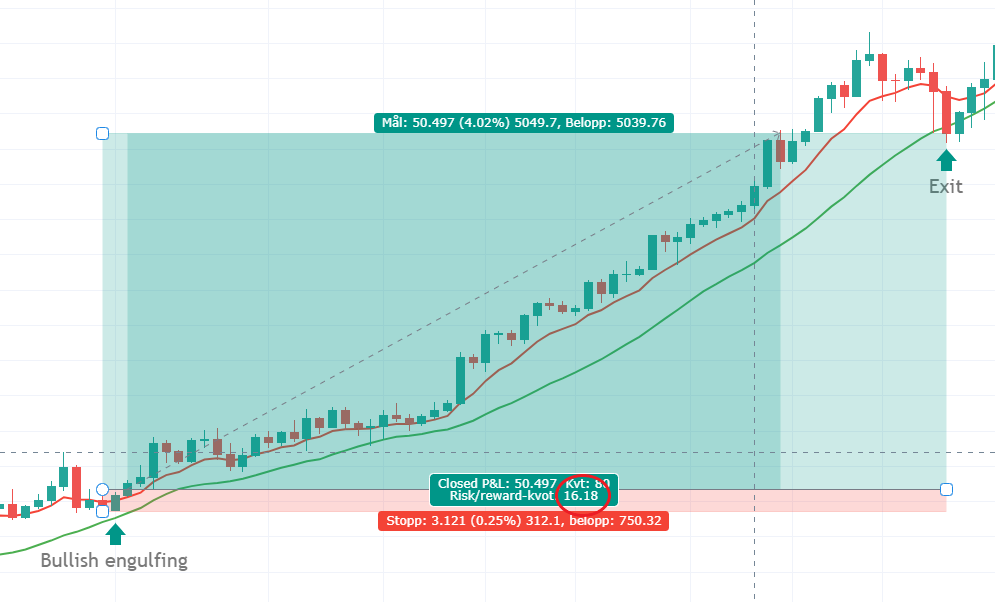
This is where the red line, EMA 8, comes into play. You simply sell when a candle closes below EMA 8, IF the following candle is below the one that closed under EMA 8. This can indicate that a potential reversal may occur in the market.
| Try our free forex signal service via Messenger: Click here |
It can be very reassuring, especially for a new trader, to have a ‘mechanical’ signal that determines when to exit the market. Otherwise, it can be difficult to judge, and for many, it becomes a decision based on gut feeling, which is not a sustainable strategy in the long run.
You can probably see several bullish engulfing candles in the gold example. With the entry we chose, the risk-reward would be as high as 16 times. This means that you have the chance to earn 16 times as much as you risk losing, and that is essentially the situation one wants to be in as a trader. A larger bullish engulfing candle signals more strength but at the same time offers a worse risk-reward compared to a smaller candle, where on the other hand, you don’t have the same sign of strength and thus less ‘certainty’.
If you go short, the pattern is the opposite and is then called bearish engulfing, and looks like in the picture here.
Many find that it can be easier to go short. This may be because markets generally fall faster than they rise, and therefore it can be mentally easier to be in such a trade. When the market rises, it often builds up more slowly, giving more time for doubt, which can lead to making irrational and drastic decisions.
How do you know that a market has a clear trend? There are several ways to assess this, but a simple method can be to apply a 200-period moving average, SMA 200, and the rule is to only take trades when the market is above or below this, depending on whether you want to go long or short. If the market is on one side of all the moving averages, for example, SMA 200, as well as SMA 20 and EMA 8, it indicates that the market is trending strongly.
Here is an example where the market is falling in the Gold market on a daily chart. Here, we have also applied a 200-period moving average as a blue line. According to the rule, it is possible to go short when we are below the line. the trading platform Markets allows you to add multiple of the same indicator.
In this example, the risk-reward ratio would have been about 6. So, it was possible to earn six times as much as one could lose. You can probably see several examples of bearish engulfing candles in the picture. Sometimes they work, other times not. But if you manage to catch such a big move, it could compensate for many smaller losing trades.
Focus on markets with a low spread – that is, a small distance between the buying and selling price so that you keep costs down.
| Try our free forex signal service via Messenger: Click here |
It can be easy to spot these patterns afterward when they have already formed on the chart. But when you are sitting ‘live’ and need to make a trade, almost at the top in a strongly trending market, it can be mentally difficult to take the trade, as it often feels like the market has reached its peak.
Price action master Al Brooks summarizes this feeling well.
‘Trends always create pullbacks that seem to be a terrible place to enter the market, but which are profitable, and reversals that look good, but are losing. Most pullbacks provide just enough of a climax that traders start to wonder if the trend is over, and in this way, traders are deceived from entering the market during the pullback’
It is important that you backtest the strategy yourself and see if it works for you. Once you have tested it, you will likely also be able to add rules that suit your trading style.