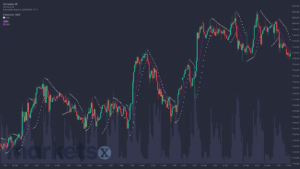
Stochastic strategies
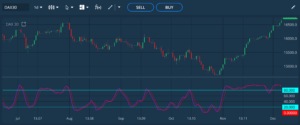
The stochastic oscillator – also called stochastics – is one of the most recognized indicators for assessing market direction in technical analysis. The stochastic oscillator is a technical indicator that enables a trader to estimate the end of a trend as well as the beginning of another trend. Before starting…
Continue reading