
While the S&P 500 has just recorded yet another all-time high, we are now entering September – the month that time and again has proven to be a dark chapter in stock market history. A look 60 years back at the largest American stock index, the S&P 500, reveals a pattern that is hard to ignore: September is the only month that on average has closed in the red, while all other months have delivered positive returns on average. But why is September specifically so weak – and will history repeat itself this year?
The red line on the chart below shows the S&P 500’s price development this year. The other lines below the red one are the average development in the index over the past 5, 10, and 15 years:
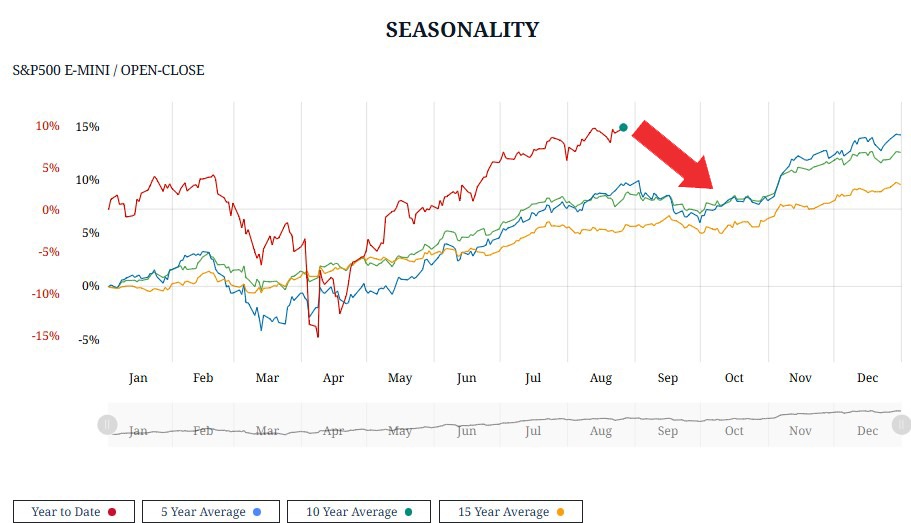
Clear September effect
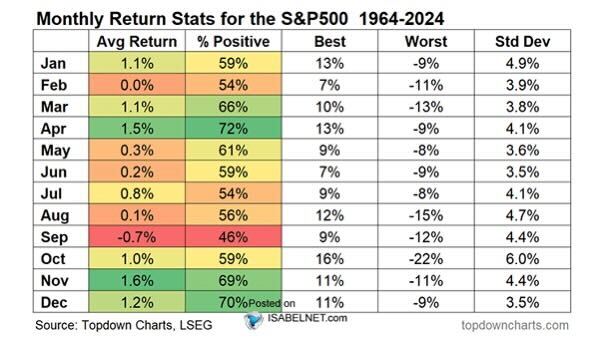
[table “5” not found /]On the chart above, we can see that the September effect is clear over the past 15 years. And if we look 60 years back in the S&P 500, the pattern’s robustness is confirmed. From 1964 to 2024, September is the only month that has an average return of minus -0.7%. It is also the only month that more often ends in the red than in the green, with a win rate of only 46%:
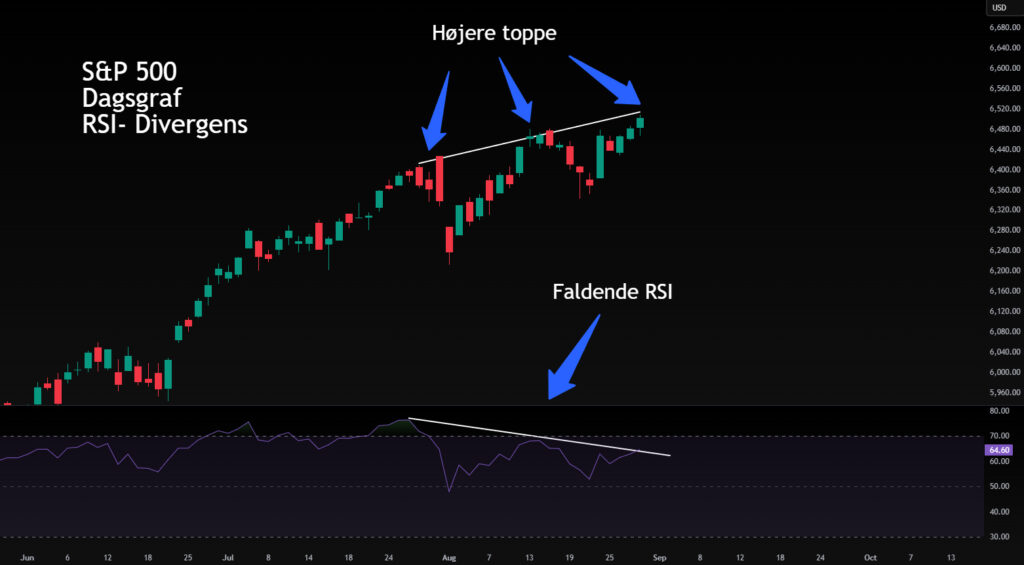
Technical signals: RSI points to weakening this year
In addition to the historical seasonal pattern, certain technical indicators also show signs that the market’s strength may be about to decline. RSI, which measures momentum in price movements, has shown declining peaks on the daily chart – often a signal that buyers are losing strength and that at least a short-term pullback may be on the way. You can use Click to short the market and thereby perhaps be lucky to ward off some of the downturn.
Why does the September effect occur?
Several theories attempt to explain the phenomenon:
- Seasonal behavior: After summer, investors and fund managers return, often with decisions to rebalance portfolios and cash in gains.
- Tax planning: Companies and investors sometimes sell out before the fiscal year-end to reduce taxes.
- Psychological factors: When many know that September is a weak month, it can become self-fulfilling – more sell in advance, which increases downward pressure.
- Macroeconomic calendar: Important economic reports and central bank decisions tend to pile up in the fall, which increases uncertainty.
No explanations are completely comprehensive, but together they can create an environment where volatility and weaker returns are more common than otherwise.
[table “5” not found /]Look forward to November
But if one as an investor has a bit of patience, there is something to look forward to in November. Here, history shows that prices surge with enthusiasm, with returns that are better than the entire rest of the year.
The long-term trend is also still strong in an upward direction, with the S&P 500 clearly above its 200-day moving average. Add to that strong corporate profits and a robust labor market – factors that can provide support to stock prices. Therefore, it is important not to blindly trust the September effect, but always to conduct one’s own analysis and include the current market situation.
The September effect is indeed real – but not set in stone. The market is complex, and historical patterns can be broken when you least expect it. The question is whether 2024 will be yet another chapter in the dark September statistics, or whether the strength in the economy will succeed in rewriting history? We will have the answer soon.
How to short the market
The following video shows how you trade with e.g. shorting via a trading platform. In this case Click.
The above video shows how to trade and short on Click.
On September 15, 2008, Lehman Brothers, the USA’s fourth-largest investment bank, went bankrupt. This was the largest bankruptcy filing in American history and catalyzed the global financial crisis. The same week, Merrill Lynch had to be sold, and AIG received a bailout. September 1929 was also the beginning of the great Wall Street crash of 1929. Here the market showed the first serious signs of weakness.