Fibonacci numbers are a widely used – and highly debated – tool for predicting price movements in financial markets. Day traders frequently employ them, though never as the sole indicator. Typically, Fibonacci tools should be combined with other elements of technical analysis to achieve favorable results. This approach ensures a more comprehensive analysis by integrating Fibonacci levels, such as retracements and extensions, with trends, support and resistance levels, and other technical indicators. The synergy between these analytical components can enhance the precision of trade setups and decision-making processes in the volatile environment of day trading.
| Try our free forex signal service via Messenger: Click here |
The Fibonacci numbers were identified by the Italian mathematician Leonardo Fibonacci in the thirteenth century. The Fibonacci sequence is an infinite series that starts as follows: 0, 1, 1, 2, 3, 5, 8, 13, 21, 34, 55, 89, 144, etc. Each number in this sequence is simply the sum of the two preceding numbers.
The Fibonacci numbers can be found in many places in nature, both in their pure form and in reflections of the numbers’ interrelations. For example, the most well-known Fibonacci ratio is 61.8%, also referred to as “the golden ratio,” and this number is found by dividing a number in the Fibonacci sequence by the number that follows it. For instance, 55/89 = 0,6178. Other important Fibonacci ratios include 23,6%, 38,2%, 50%, and 100%.
In technical analysis, Fibonacci is used by taking the highest and lowest points in a price movement and calculating, for example, 61,8% of the total distance. Once this and possibly other Fibonacci levels are defined, horizontal lines are drawn that can be used to indicate potential support and resistance levels.
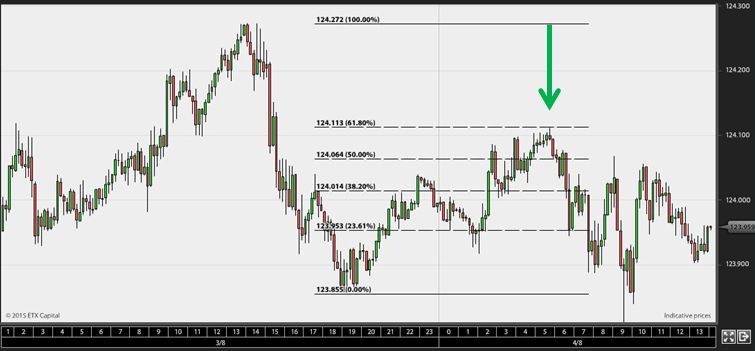
Below is an example of a Fibonacci retracement, where the price first drops and then retraces 61,8% of the fall.
When we talk about a retracement, it refers to the price “pulling back.” For instance, after a significant downward move, there tends to be a tendency for the price to rebound slightly upwards towards where it came from, before continuing its downward trajectory. It’s common to pay particular attention to the 61,8% and 50% levels during such retracements, and in cases where the trend is very strong, 38,2% can also serve as a potential turning point.

These setups often occur in forex markets, indices, gold, and oil, but they need to be confirmed by other indicators.
It might be challenging to understand why these levels should matter in the price development on financial markets. One reason is that so many traders and investors watch these levels, and incorporate them into their analyses, thereby giving them a self-reinforcing effect as potential turning points on a chart.
Although Fibonacci numbers and ratios appear to be frequently useful in analyzing price movements, it’s important to state that they cannot stand alone. They should be used in conjunction with other elements of technical analysis, such as trend channels or some of the indicators mentioned elsewhere on this site.