TECHNICAL ANALYSIS

ABCD Patterns

ABCD Patterns

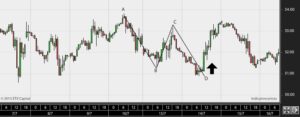
The ABCD pattern is one of the most well-known patterns in technical trading. In a more advanced form, it is also known as Gartley patterns. The ABCD pattern describes a correction in the market with a wave formation either in a downward or upward direction. When the formation is completed,…
Continue reading

Double bottoms and tops

Double bottoms and tops

Double bottoms and double tops are well-known patterns that often occur in financial markets. They frequently appear at the end of a trend, signaling the potential reversal of that trend. These patterns often take the form of a double bottom resembling a large “W” and a double top resembling a…
Continue reading

Candlesticks

Candlesticks

In addition to the usual depiction of price charts in forms such as line charts or bar charts, many traders use a slightly more advanced and informative graph, called a candlestick chart or simply a candle chart. The chart is named after the individual columns, which resemble candles, and are…
Continue reading

Bollinger Bands

Bollinger Bands

Bollinger Bands® is an indicator that measures market volatility. Bollinger Bands® was invented by the technical analyst John Bollinger in the 1980s, and he obtained trademark protection for the indicator in 2011. Bollinger Bands® consists of three lines: A middle line and an upper and lower line, often encapsulating the…
Continue reading

5-1-Daytrading strategy

5-1-Daytrading strategy

The 5-1 strategy was developed by the Danish day trader Hans-Henrik Nielsen from Markettimer, known for his simple yet effective strategies. The 5-1 strategy is a distinct day trading strategy. It can be used in its simplest form, but it can also be advantageously refined with additional indicators. The strategy…
Continue reading

Engulfing strategy

Engulfing strategy

When prices move sharply up or down, diving headfirst into the market is tempting. However, trading based on emotions often ends poorly. Therefore, we have found a simple strategy that can help most day traders “keep a level head” – at the same time, allowing you to participate effectively in…
Continue reading

Cup & Handle Patterns

Cup & Handle Patterns

Cup & Handle is a so-called bullish candlestick pattern that resembles a teacup and is considered one of the most reliable buying formations if you want to safely enter a rising trend in the market. In this article, we explain what the Cup & Handle pattern is. You will learn…
Continue reading